Real estate price map
Real estate price map in the municipality of Cherbourg-en-Cotentin, choose a section to see transactions by parcel.
Price per m² in Cherbourg-en-Cotentin
Median price of real estate
in the municipality of Cherbourg-en-Cotentin
2 772 € /m²
2 867 € /m²
2 794 € /m²
15002 transactions listed in the municipality
Yearly data
Yearly evolution of the median price per m²

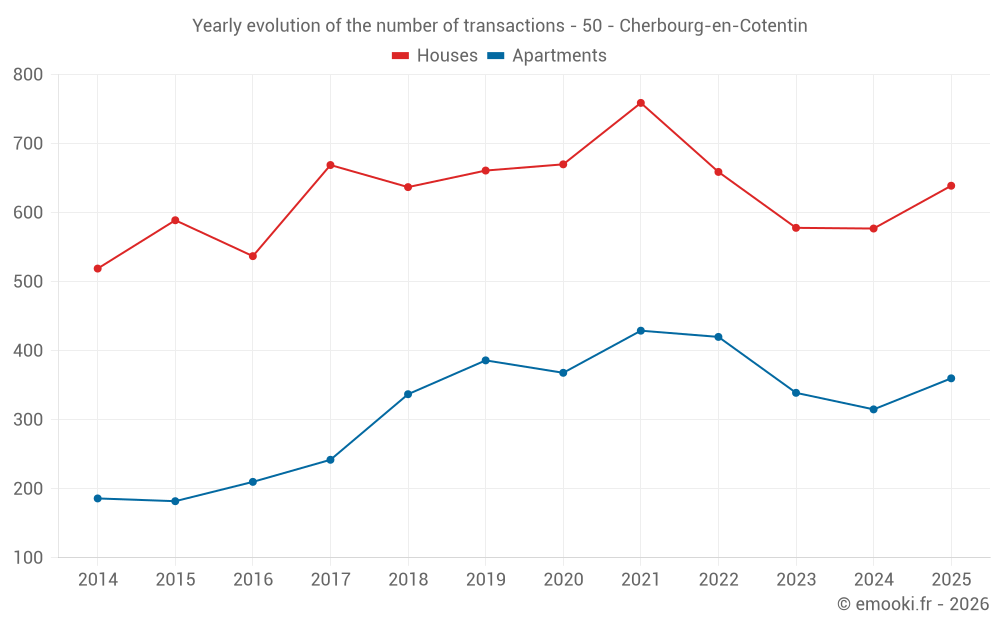
Yearly evolution of the number of transactions
Yearly table
transactions
Price per m²
transactions
Price per m²
Analysis
Structure of prices per m²
Values of price percentiles per m² over the periods used for the estimated price of each type of property.
Structure of transaction amounts
Values of transaction amounts percentiles over the periods used for the estimated price of each type of property.
Transaction amounts and prices per m² by percentile
Price per m²
Transaction amount
Price per m²
Transaction amount
National and departmental comparison
Evolution of the median price per m² of houses
Evolution of the median price per m² of apartments
Quarterly data
Quarterly evolution of the median price per m²
Quarterly evolution of the number of transactions
Quarterly table
transactions
Price per m²
transactions
Price per m²
Key takeaways
What is the price per m2 of houses in Cherbourg-en-Cotentin?
The median price on the 156 house transactions of the last 3 months in the municipality of Cherbourg-en-Cotentin was 2 276 € per square meter for a median property value of 211 500 €. Over this period, 60% of transactions were between 1 833 and 2 772 € per square meter (from the 2nd to the 8th deciles).
What is the price per m2 of apartments in Cherbourg-en-Cotentin?
The median price on the 100 apartment transactions of the last 3 months in the municipality of Cherbourg-en-Cotentin was 2 344 € per square meter for a median property value of 121 000 €. Over this period, 60% of transactions were between 1 893 and 2 867 € per square meter (from the 2nd to the 8th deciles).
Compare with neighboring municipalities
name
Price per m²
Price per m²
City information
Zip codes
- CHERBOURG 50100 CHERBOURG EN COTENTIN
- TOURLAVILLE 50110 CHERBOURG EN COTENTIN
- EQUEURDREVILLE HAINNEVILLE 50120 CHERBOURG EN COTENTIN
- CHERBOURG 50130 CHERBOURG EN COTENTIN
- OCTEVILLE 50130 CHERBOURG EN COTENTIN
- QUERQUEVILLE 50460 CHERBOURG EN COTENTIN
- LA GLACERIE 50470 CHERBOURG EN COTENTIN