emooki
HomePrice mapTransactions
🇬🇧 English🇫🇷 Français🇩🇪 Deutsch🇪🇸 Español🇮🇹 Italiano

Real estate price map


Real estate price map in the municipality of Granville, choose a section to see transactions by parcel.

Manche (50)
Granville

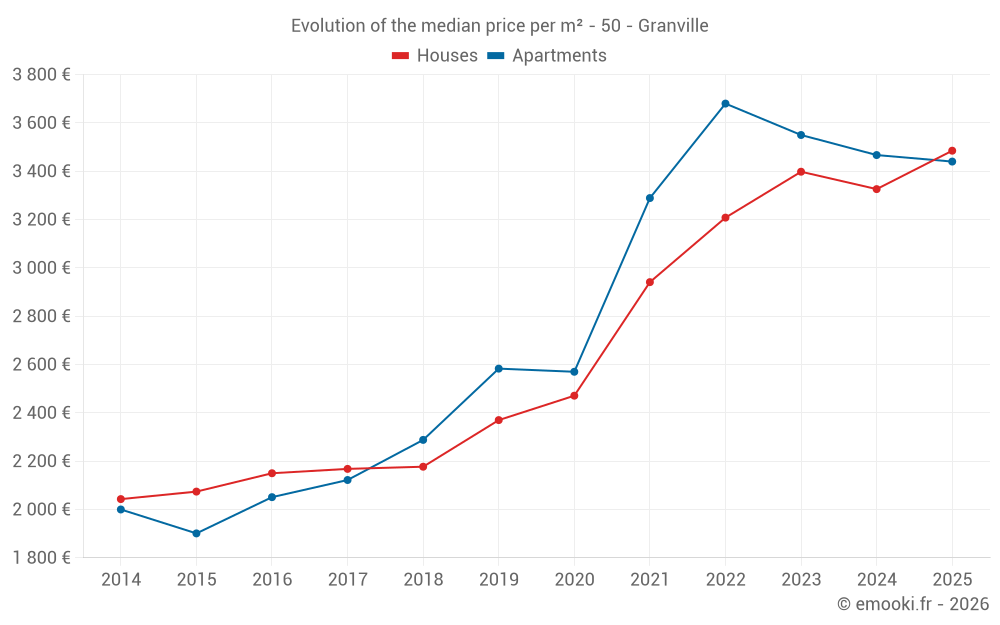
Median price of real estate
in the municipality of Granville

HousesHouses
3 485 € /m²
1-23-45-67-89-10
Reliability 9/10
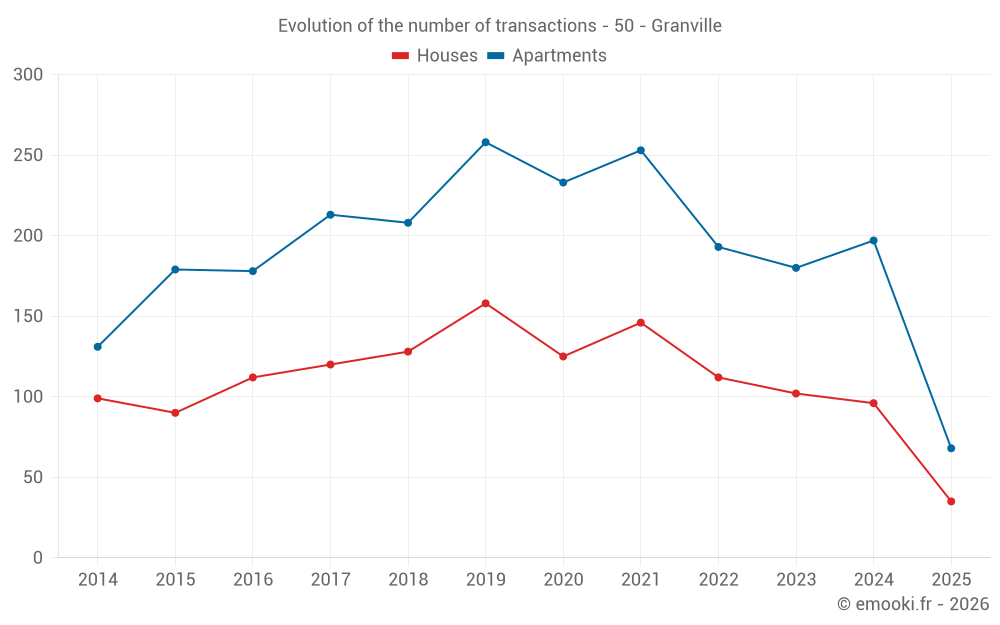
Median price on the 35 transactions of the last 6 months.
from 2 810 to
5 593 € /m²
60% of transactions from the 2nd to the 8th deciles.
ApartmentsApartments
3 958 € /m²
1-23-45-67-89-10
Reliability 10/10
Median price on the 32 transactions of the last 3 months.
from 2 307 to
4 504 € /m²
60% of transactions from the 2nd to the 8th deciles.
DwellingsDwellings
3 712 € /m²
1-23-45-67-89-10
Reliability 10/10
Median price on the 48 transactions of the last 3 months.
from 2 632 to
4 662 € /m²
60% of transactions from the 2nd to the 8th deciles.
HousesEvolution of the price per m² of houses since...
1 year
+4.8%
2 years
+2.6%
3 years
+8.6%
4 years
+18%
5 years
+41%
6 years
+47%
7 years
+60%
8 years
+61%
9 years
+62%
10 years
+68%
11 years
+71%
ApartmentsEvolution of the price per m² of apartments since...
1 year
-0.8%
2 years
-3.1%
3 years
-6.5%
4 years
+4.6%
5 years
+34%
6 years
+33%
7 years
+50%
8 years
+62%
9 years
+68%
10 years
+81%
11 years
+72%
The price per m² of apartments has decreased by 6.5% since 3 years, but it has increased by 81% in 10 years.

Yearly evolution

Evolution of the median price per m²

Evolution of the number of transactions

Warning, last year incomplete. Projections made based on the proportions between semesters of the previous year at the departmental/national level and by type of property.

Yearly data

Descending order
Year
Houses
house
transactions
Houses
house
Price per m²
Apartments
apt.
transactions
Apartments
apt.
Price per m²
2025
35
3 485 €
68
3 440 €
2024
96
3 326 €
197
3 467 €
2023
102
3 398 €
180
3 550 €
2022
112
3 208 €
193
3 680 €
2021
146
2 941 €
253
3 289 €
2020
125
2 471 €
233
2 570 €
2019
158
2 370 €
258
2 583 €
2018
128
2 177 €
208
2 288 €
2017
120
2 168 €
213
2 122 €
2016
112
2 150 €
178
2 051 €
2015
90
2 074 €
179
1 901 €
2014
99
2 043 €
131
2 000 €

Analysis

Structure of prices per m²

Values of price percentiles per m² over the periods used for the estimated price of each type of property.

Structure of transaction amounts

Values of transaction amounts percentiles over the periods used for the estimated price of each type of property.

Transaction amounts and prices per m² by percentile

Ascending order
Percentile
Houses
house
Price per m²
Houses
house
Transaction amount
Apartments
apt.
Price per m²
Apartments
apt.
Transaction amount
10th percentile
2 620 €
217 K€
2 001 €
120 K€
20th percentile
2 810 €
250 K€
2 307 €
141 K€
30th percentile
3 080 €
260 K€
2 954 €
166 K€
40th percentile
3 334 €
297 K€
3 456 €
174 K€
50th percentile
3 485 €
330 K€
3 958 €
190 K€
60th percentile
3 807 €
366 K€
4 124 €
208 K€
70th percentile
4 127 €
401 K€
4 375 €
227 K€
80th percentile
5 593 €
432 K€
4 504 €
291 K€
90th percentile
6 544 €
509 K€
4 782 €
394 K€

National and departmental comparison

Evolution of the median price per m² of houses

Evolution of the median price per m² of apartments

Quarterly evolution

Evolution of the median price per m²

Evolution of the number of transactions

Quarterly data

Descending order
Quarter
Houses
house
transactions
Houses
house
Price per m²
Apartments
apt.
transactions
Apartments
apt.
Price per m²
2025 Q2
16
3 474 €
32
3 958 €
2025 Q1
19
3 611 €
36
3 338 €
2024 Q4
27
3 329 €
48
3 920 €
2024 Q3
25
3 212 €
49
3 469 €
2024 Q2
21
3 644 €
58
3 312 €
2024 Q1
23
3 219 €
42
3 368 €
2023 Q4
25
3 055 €
43
3 478 €
2023 Q3
21
3 790 €
51
3 583 €
2023 Q2
30
3 416 €
44
3 609 €
2023 Q1
26
3 304 €
42
3 555 €
2022 Q4
34
3 331 €
51
4 020 €
2022 Q3
29
3 750 €
47
3 632 €
2022 Q2
30
3 090 €
53
3 613 €
2022 Q1
19
2 879 €
42
3 588 €
2021 Q4
37
3 194 €
67
3 538 €
2021 Q3
37
3 019 €
53
3 500 €
2021 Q2
31
2 849 €
67
3 304 €
2021 Q1
41
2 606 €
66
2 951 €
2020 Q4
40
2 635 €
53
2 667 €
2020 Q3
30
2 212 €
58
2 870 €
2020 Q2
30
2 594 €
61
2 542 €
2020 Q1
25
2 405 €
61
2 447 €
2019 Q4
50
2 296 €
72
2 286 €
2019 Q3
31
2 636 €
64
2 932 €
2019 Q2
44
2 282 €
67
2 591 €
2019 Q1
33
2 523 €
55
2 549 €
2018 Q4
39
2 162 €
59
2 239 €
2018 Q3
35
2 240 €
46
2 602 €
2018 Q2
27
2 212 €
58
2 266 €
2018 Q1
27
2 000 €
45
2 114 €
2017 Q4
33
2 222 €
58
2 310 €
2017 Q3
31
2 106 €
57
2 000 €
2017 Q2
34
2 088 €
55
2 147 €
2017 Q1
22
2 185 €
43
2 345 €
2016 Q4
27
2 279 €
56
2 143 €
2016 Q3
30
2 202 €
47
2 102 €
2016 Q2
33
1 996 €
52
2 011 €
2016 Q1
22
2 252 €
23
1 644 €
2015 Q4
22
2 535 €
56
1 922 €
2015 Q3
24
2 096 €
44
1 748 €
2015 Q2
26
2 074 €
49
2 109 €
2015 Q1
18
1 838 €
30
1 900 €
2014 Q4
30
2 018 €
28
2 124 €
2014 Q3
23
1 938 €
24
1 783 €
2014 Q2
17
2 219 €
35
2 084 €
2014 Q1
29
2 056 €
44
1 990 €

Overview of the latest real estate transactions

The following list is an anonymized overview of the latest transactions. For more details and to find all transactions, please use the map to view transactions by plot or the transaction search page for a search by criteria.

2025-06-27
234 000 €
4 415 € /m²(53 m²)
Sale
Apartments
Apartment
2 rooms
20 m2
Apartments
Apartment
1 room
33 m2
1 outbuilding
Land
156 m2
-Sols
2025-06-25
140 000 €
3 500 € /m²(40 m²)
Sale
Apartments
Apartment
1 room
40 m2
2025-06-20
505 000 €
8 145 € /m²(62 m²)
Sale
Apartments
Apartment
4 rooms
62 m2
1 outbuilding
2025-06-20
207 500 €
3 051 € /m²(68 m²)
Sale
Apartments
Apartment
3 rooms
68 m2
2 outbuildings
2025-06-20
212 000 €
1 797 € /m²(118 m²)
Sale
Apartments
Apartment
4 rooms
118 m2
2025-06-16
184 000 €
4 000 € /m²(46 m²)
Sale
Apartments
Apartment
2 rooms
46 m2
1 outbuilding
2025-06-12
125 000 €
4 032 € /m²(31 m²)
Sale
Apartments
Apartment
1 room
31 m2
1 outbuilding
2025-06-11
299 000 €
3 691 € /m²(81 m²)
Sale
Houses
House
4 rooms
81 m2
Land
502 m2
-Sols
2025-06-05
7 000 €
Sale
Land
7182 m2
-Terres
2025-06-05
359 000 €
3 485 € /m²(103 m²)
Sale
Houses
House
5 rooms
103 m2
Land
603 m2
-Sols
2025-06-05
400 000 €
6 061 € /m²(66 m²)
Sale
Houses
House
3 rooms
66 m2
1 outbuilding
Land
101 m2
-Sols
2025-06-03
177 500 €
3 008 € /m²(59 m²)
Sale
Commercial property
59 m2
2025-06-02
235 000 €
3 917 € /m²(60 m²)
Sale
Apartments
Apartment
3 rooms
60 m2
2025-05-31
120 000 €
2 667 € /m²(45 m²)
Sale
Commercial property
45 m2
2 outbuildings
2025-05-31
413 000 €
4 747 € /m²(87 m²)
Sale
Apartments
Apartment
1 room
25 m2
Apartments
Apartment
1 room
37 m2
Apartments
Apartment
1 room
25 m2
1 outbuilding
Land
114 m2
-Sols
2025-05-31
36 000 €
Sale
1 outbuilding
2025-05-28
198 000 €
2 912 € /m²(68 m²)
Sale
Apartments
Apartment
3 rooms
68 m2
1 outbuilding
2025-05-28
220 000 €
1 774 € /m²(124 m²)
Sale
Commercial property
124 m2
2025-05-21
32 000 €
Sale
1 outbuilding
2025-05-21
115 000 €
4 107 € /m²(28 m²)
Sale
Apartments
Apartment
1 room
28 m2
2 outbuildings

Manche (50)

Most expensive cities

City
name
Descending orderHouses
house
Price per m²
3 741 €
3 674 €
3 611 €
3 540 €
3 485 €
3 437 €
3 272 €
3 139 €
3 125 €
3 050 €
City
name
Descending orderApartments
apt.
Price per m²
4 066 €
4 008 €
3 988 €
3 958 €
3 940 €
3 911 €
3 698 €
3 692 €
3 627 €
3 463 €

Least expensive cities

City
name
Ascending orderHouses
house
Price per m²
671 €
696 €
700 €
703 €
804 €
808 €
817 €
817 €
840 €
City
name
Ascending orderApartments
apt.
Price per m²
254 €
290 €
303 €
333 €
362 €
448 €
540 €
554 €
569 €