emooki
HomePrice mapTransactions
🇬🇧 English🇫🇷 Français🇩🇪 Deutsch🇪🇸 Español🇮🇹 Italiano

Real estate price map


Real estate price map in the municipality of Saint-Georges-de-Rouelley, choose a section to see transactions by parcel.

Manche (50)

Saint-Georges-de-Rouelley - Real estate price m²

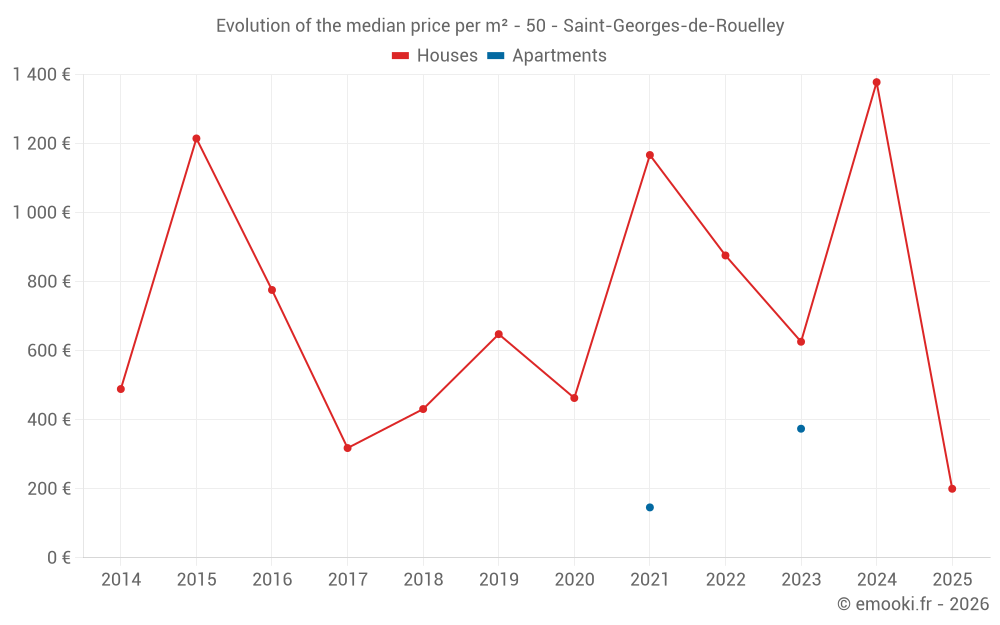
Median price of real estate
in the municipality of Saint-Georges-de-Rouelley

HousesHouses
928  /m²
1-23-45-67-89-10
Reliability 6/10
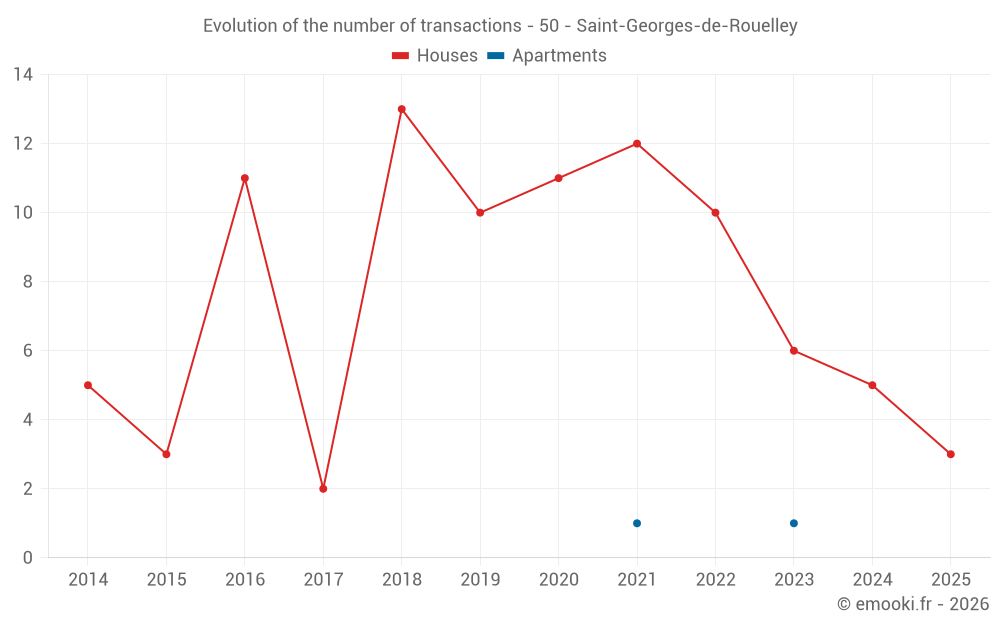
Median price on the 19 transactions of the last 36 months.
from 194 to
1 414  /m²
60% of transactions from the 2nd to the 8th deciles.
ApartmentsApartments
260  /m²
1-23-45-67-89-10
Reliability 1/10
Median price on the 2 transactions of the last 120 months.
DwellingsDwellings
776  /m²
1-23-45-67-89-10
Reliability 6/10
Median price on the 20 transactions of the last 36 months.
from 197 to
1 413  /m²
60% of transactions from the 2nd to the 8th deciles.

Yearly evolution

Evolution of the median price per m²

Evolution of the median price per m² - 50 - Saint-Georges-de-Rouelley

Evolution of the number of transactions

Warning, last year incomplete. Projections made based on the proportions between semesters of the previous year at the departmental/national level and by type of property.

Evolution of the number of transactions - 50 - Saint-Georges-de-Rouelley

Yearly data

Descending order
Year
Houses
house
transactions
Houses
house
Price per m²
Apartments
apt.
transactions
Apartments
apt.
Price per m²
2025
3
200 
0
--- 
2024
5
1 378 
0
--- 
2023
6
626 
1
374 
2022
10
876 
0
--- 
2021
12
1 167 
1
146 
2020
11
463 
0
--- 
2019
10
648 
0
--- 
2018
13
431 
0
--- 
2017
2
318 
0
--- 
2016
11
776 
0
--- 
2015
3
1 215 
0
--- 
2014
5
489 
0
--- 

Analysis

Structure of prices per m²

Values of price percentiles per m² over the periods used for the estimated price of each type of property.

Structure of transaction amounts

Values of transaction amounts percentiles over the periods used for the estimated price of each type of property.

Transaction amounts and prices per m² by percentile

Ascending order
Percentile
Houses
house
Price per m²
Houses
house
Transaction amount
Apartments
apt.
Price per m²
Apartments
apt.
Transaction amount
10th percentile
150 
10 000 
169 
24 966 
20th percentile
194 
20 600 
192 
27 933 
30th percentile
428 
26 400 
214 
30 900 
40th percentile
619 
40 400 
237 
33 866 
50th percentile
928 
59 400 
260 
36 832 
60th percentile
1 208 
62 320 
283 
39 799 
70th percentile
1 327 
78 200 
306 
42 766 
80th percentile
1 414 
102 K
328 
45 732 
90th percentile
1 656 
143 K
351 
48 698 

National and departmental comparison

Evolution of the median price per m² of houses

Evolution of the median price per m² of apartments

Quarterly evolution

Evolution of the median price per m²

Evolution of the number of transactions

Quarterly data

Descending order
Quarter
Houses
house
transactions
Houses
house
Price per m²
Apartments
apt.
transactions
Apartments
apt.
Price per m²
2025 Q1
3
200 
0
--- 
2024 Q4
1
1 688 
0
--- 
2024 Q3
3
1 378 
0
--- 
2024 Q2
1
1 250 
0
--- 
2023 Q3
2
870 
0
--- 
2023 Q2
3
928 
0
--- 
2023 Q1
1
150 
1
374 
2022 Q4
2
602 
0
--- 
2022 Q3
3
1 200 
0
--- 
2022 Q2
1
922 
0
--- 
2022 Q1
4
876 
0
--- 
2021 Q4
4
1 167 
1
146 
2021 Q3
1
1 432 
0
--- 
2021 Q2
3
960 
0
--- 
2021 Q1
4
1 167 
0
--- 
2020 Q4
4
600 
0
--- 
2020 Q3
2
710 
0
--- 
2020 Q2
2
337 
0
--- 
2020 Q1
3
452 
0
--- 
2019 Q4
4
788 
0
--- 
2019 Q3
4
895 
0
--- 
2019 Q2
1
408 
0
--- 
2019 Q1
1
146 
0
--- 
2018 Q4
4
530 
0
--- 
2018 Q3
4
490 
0
--- 
2018 Q2
2
373 
0
--- 
2018 Q1
3
779 
0
--- 
2017 Q2
1
56 
0
--- 
2017 Q1
1
580 
0
--- 
2016 Q4
2
565 
0
--- 
2016 Q3
3
573 
0
--- 
2016 Q2
3
1 139 
0
--- 
2016 Q1
3
978 
0
--- 
2015 Q4
1
1 027 
0
--- 
2015 Q3
1
1 341 
0
--- 
2015 Q2
1
1 215 
0
--- 
2014 Q4
1
102 
0
--- 
2014 Q3
2
1 100 
0
--- 
2014 Q2
2
321 
0
--- 

Overview of the latest real estate transactions

The following list is an anonymized overview of the latest transactions. For more details and to find all transactions, please use the map to view transactions by plot or the transaction search page for a search by criteria.

2025-06-20
2 850 
Exchange
Land
2737 m2
-Prés
Land
3883 m2
-Prés
Land
7404 m2
-Prés
Land
96 m2
-Prés
2025-06-20
13 950 
Exchange
Land
4900 m2
-Terres
Land
4890 m2
-Terres
Land
16492 m2
-Prés
Land
2868 m2
-Prés
2025-06-20
19 200 
Exchange
Land
16492 m2
-Prés
Land
2737 m2
-Prés
Land
96 m2
-Prés
2025-05-13
3 000 
Sale
Land
9360 m2
-Prés
2025-05-07
25 000 
Exchange
Land
28065 m2
-Prés
Land
1120 m2
-Prés
Land
13380 m2
-Vergers
2025-05-07
18 766 
Exchange
Land
23458 m2
-Terres
2025-04-17
2 500 
Sale
Land
100 m2
-Sols
Land
14 m2
-Sols
Land
7 m2
-Sols
Land
81 m2
-Sols
Land
11 m2
-Vergers
Land
70 m2
-Sols
2025-03-13
5 000 
Sale
Land
1209 m2
-Prés
Land
2043 m2
-Prés
2025-03-10
4 500 
Sale
Land
6602 m2
-Prés
2025-03-10
62 400 
624  /m²(100 m²)
Sale
Houses
House
4 rooms
100 m2
1 outbuilding
Land
404 m2
-Sols
Land
383 m2
-Sols
2025-02-27
10 000 
133  /m²(75 m²)
Sale
Houses
House
4 rooms
75 m2
1 outbuilding
Land
1590 m2
-Sols
Land
67 m2
-Sols
Land
1797 m2
-Vergers
Land
187 m2
-Vergers
Land
500 m2
-Sols
Land
817 m2
-Vergers
2025-02-26
81 750 
Sale
Land
389 m2
-Sols
2025-02-07
10 000 
200  /m²(50 m²)
Sale
Houses
House
3 rooms
50 m2
Land
62 m2
-Sols
2025-02-05
24 165 
Sale
Land
23590 m2
-Prés
Land
15702 m2
-Prés
Land
9038 m2
-Prés
2025-01-09
5 580 
Sale
Land
620 m2
-Terrains à bâtir
2024-12-19
1 
Sale
Land
45 m2
-Terrains d'agrément
2024-10-18
108 000 
1 688  /m²(64 m²)
Sale
Houses
House
3 rooms
64 m2
Land
70 m2
-Sols
Land
58 m2
-Sols
Land
109 m2
-Prés
2024-10-11
19 000 
Sale
2 outbuildings
Land
75 m2
-Sols
2024-10-01
1 
Sale
Land
25 m2
-Sols
Land
186 m2
-Sols
Land
7 m2
-Sols
Land
787 m2
-Sols
2024-09-19
141 240 
1 412  /m²(100 m²)
Sale
Houses
House
3 rooms
100 m2
1 outbuilding
Land
283 m2
-Sols
Land
29 m2
-Sols
Land
144 m2
-Jardins
275 transactions listed in the municipality

Manche (50)

Most expensive cities

City
name
Descending orderHouses
house
Price per m²
3 741 
3 485 
3 272 
3 050 
City
name
Descending orderApartments
apt.
Price per m²
4 066 
3 988 
3 958 
3 627 
3 463 

Least expensive cities

City
name
Ascending orderHouses
house
Price per m²
671 
700 
703 
804 
808 
817 
817 
840 
City
name
Ascending orderApartments
apt.
Price per m²
254 
290 
303 
333 
362 
448 
540