Real estate price map
Real estate price map in the municipality of Le Teilleul, choose a section to see transactions by parcel.
Manche (50)
Price per m² in Le Teilleul
Median price of real estate
in the municipality of Le Teilleul
Houses
1 179 € /m²
Reliability 9/10
Median price on the 21 transactions of the last 6 months.
from 681 to
1 593 € /m²
1 593 € /m²
60% of transactions from the 2nd to the 8th deciles.
Apartments
362 € /m²
Reliability 1/10
Price of the unique transaction of the last 120 months.
Dwellings
1 179 € /m²
Reliability 9/10
Median price on the 21 transactions of the last 6 months.
from 681 to
1 593 € /m²
1 593 € /m²
60% of transactions from the 2nd to the 8th deciles.
Evolution of the price per m² of houses since...
1 year
+29%
2 years
+30%
3 years
+20%
4 years
+35%
5 years
+58%
6 years
+83%
7 years
+52%
8 years
+41%
9 years
+44%
10 years
+112%
11 years
+66%
893 transactions listed in the municipality
Yearly data
Yearly evolution of the median price per m²

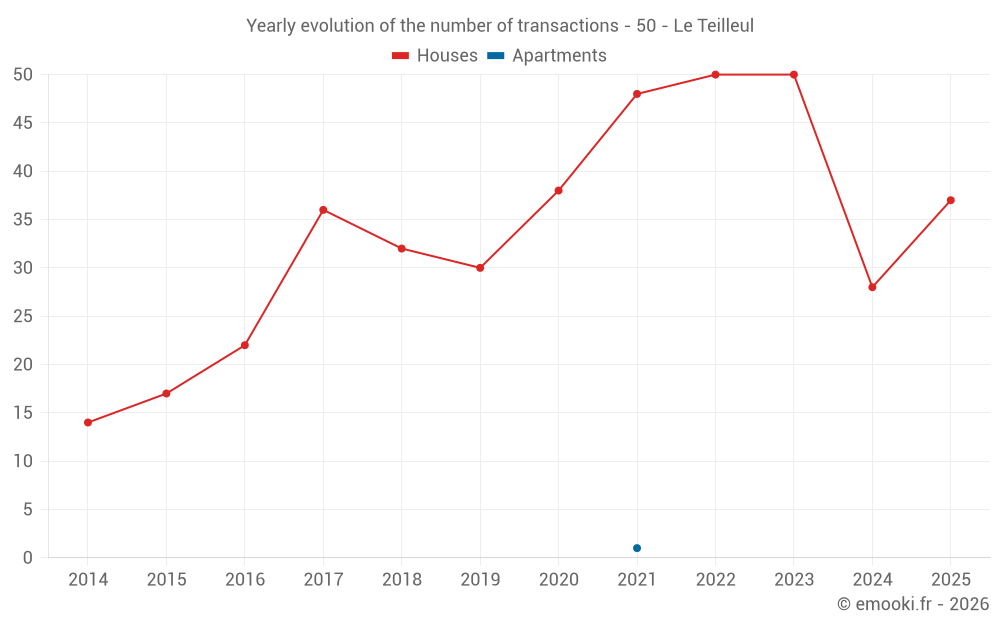
Yearly evolution of the number of transactions
Yearly table
Year
house
transactions
transactions
house
Price per m²
Price per m²
apt.
transactions
transactions
apt.
Price per m²
Price per m²
2025
37
1 136 €
0
--- €
2024
28
882 €
0
--- €
2023
50
877 €
0
--- €
2022
50
946 €
0
--- €
2021
48
840 €
1
362 €
2020
38
719 €
0
--- €
2019
30
622 €
0
--- €
2018
32
748 €
0
--- €
2017
36
806 €
0
--- €
2016
22
790 €
0
--- €
2015
17
537 €
0
--- €
2014
14
683 €
0
--- €
Analysis
Structure of prices per m²
Values of price percentiles per m² over the periods used for the estimated price of each type of property.
Structure of transaction amounts
Values of transaction amounts percentiles over the periods used for the estimated price of each type of property.
Transaction amounts and prices per m² by percentile
Percentile
house
Price per m²
Price per m²
house
Transaction amount
Transaction amount
apt.
Price per m²
Price per m²
apt.
Transaction amount
Transaction amount
10th percentile
409 €
28 000 €
362 €
60 100 €
20th percentile
681 €
55 000 €
362 €
60 100 €
30th percentile
764 €
85 000 €
362 €
60 100 €
40th percentile
875 €
100 K€
362 €
60 100 €
50th percentile
1 179 €
120 K€
362 €
60 100 €
60th percentile
1 290 €
140 K€
362 €
60 100 €
70th percentile
1 434 €
145 K€
362 €
60 100 €
80th percentile
1 593 €
184 K€
362 €
60 100 €
90th percentile
2 353 €
186 K€
362 €
60 100 €
National and departmental comparison
Evolution of the median price per m² of houses
Evolution of the median price per m² of apartments
Quarterly data
Quarterly evolution of the median price per m²
Quarterly evolution of the number of transactions
Quarterly table
Quarter
house
transactions
transactions
house
Price per m²
Price per m²
apt.
transactions
transactions
apt.
Price per m²
Price per m²
2025 Q4
14
1 270 €
0
--- €
2025 Q3
7
1 051 €
0
--- €
2025 Q2
11
1 136 €
0
--- €
2025 Q1
5
773 €
0
--- €
2024 Q4
6
1 080 €
0
--- €
2024 Q3
4
657 €
0
--- €
2024 Q2
9
993 €
0
--- €
2024 Q1
9
844 €
0
--- €
2023 Q4
12
866 €
0
--- €
2023 Q3
11
844 €
0
--- €
2023 Q2
10
1 056 €
0
--- €
2023 Q1
17
733 €
0
--- €
2022 Q4
10
1 086 €
0
--- €
2022 Q3
14
963 €
0
--- €
2022 Q2
10
661 €
0
--- €
2022 Q1
16
893 €
0
--- €
2021 Q4
14
883 €
0
--- €
2021 Q3
21
854 €
0
--- €
2021 Q2
7
637 €
1
362 €
2021 Q1
6
796 €
0
--- €
2020 Q4
17
830 €
0
--- €
2020 Q3
6
778 €
0
--- €
2020 Q2
6
878 €
0
--- €
2020 Q1
9
677 €
0
--- €
2019 Q4
11
457 €
0
--- €
2019 Q3
8
694 €
0
--- €
2019 Q2
3
315 €
0
--- €
2019 Q1
8
632 €
0
--- €
2018 Q4
11
952 €
0
--- €
2018 Q3
8
706 €
0
--- €
2018 Q2
5
783 €
0
--- €
2018 Q1
8
646 €
0
--- €
2017 Q4
6
358 €
0
--- €
2017 Q3
11
780 €
0
--- €
2017 Q2
11
943 €
0
--- €
2017 Q1
8
994 €
0
--- €
2016 Q4
3
708 €
0
--- €
2016 Q3
6
648 €
0
--- €
2016 Q2
5
969 €
0
--- €
2016 Q1
8
637 €
0
--- €
2015 Q4
3
553 €
0
--- €
2015 Q3
4
484 €
0
--- €
2015 Q2
4
758 €
0
--- €
2015 Q1
6
714 €
0
--- €
2014 Q4
4
683 €
0
--- €
2014 Q3
6
1 122 €
0
--- €
2014 Q2
1
362 €
0
--- €
2014 Q1
3
2 083 €
0
--- €
Key takeaways
What is the price per m2 of houses in Le Teilleul?
The median price on the 21 house transactions of the last 6 months in the municipality of Le Teilleul was 1 179 € per square meter for a median property value of 120 000 €. Over this period, 60% of transactions were between 681 and 1 593 € per square meter (from the 2nd to the 8th deciles).
Compare with neighboring municipalities
City
name
name
house
Price per m²
Price per m²
apt.
Price per m²
Price per m²
City information
Zip codes
- 50640 LE TEILLEUL
- FERRIERES 50640 LE TEILLEUL
- HEUSSE 50640 LE TEILLEUL
- HUSSON 50640 LE TEILLEUL
- STE MARIE DU BOIS 50640 LE TEILLEUL