Real estate price map
Real estate price map in the municipality of La Hague, choose a section to see transactions by parcel.
Price per m² in La Hague
Median price of real estate
in the municipality of La Hague
3 802 € /m²
3 802 € /m²
2445 transactions listed in the municipality
Yearly data
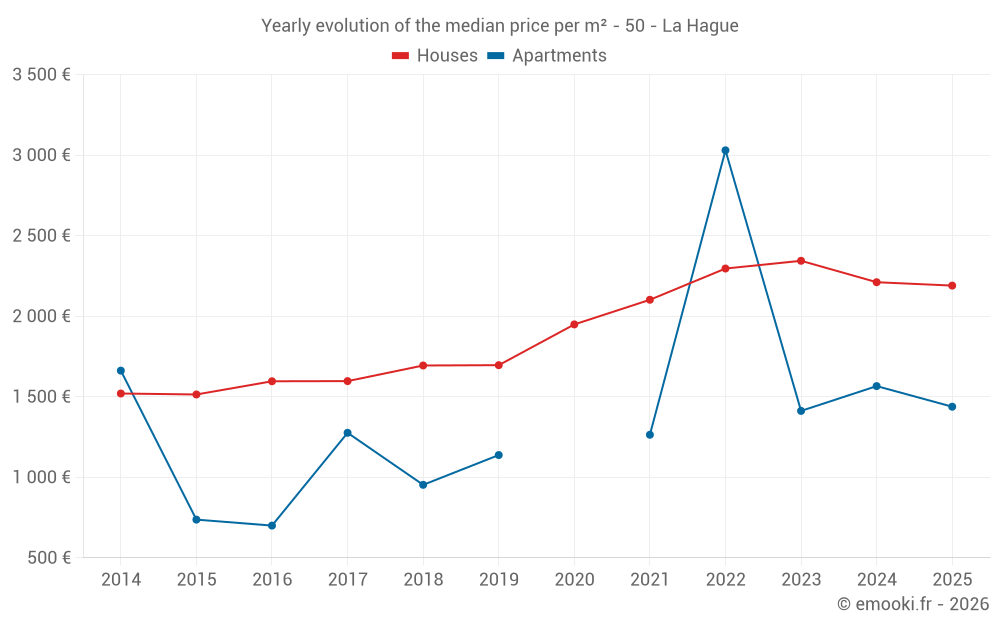
Yearly evolution of the median price per m²
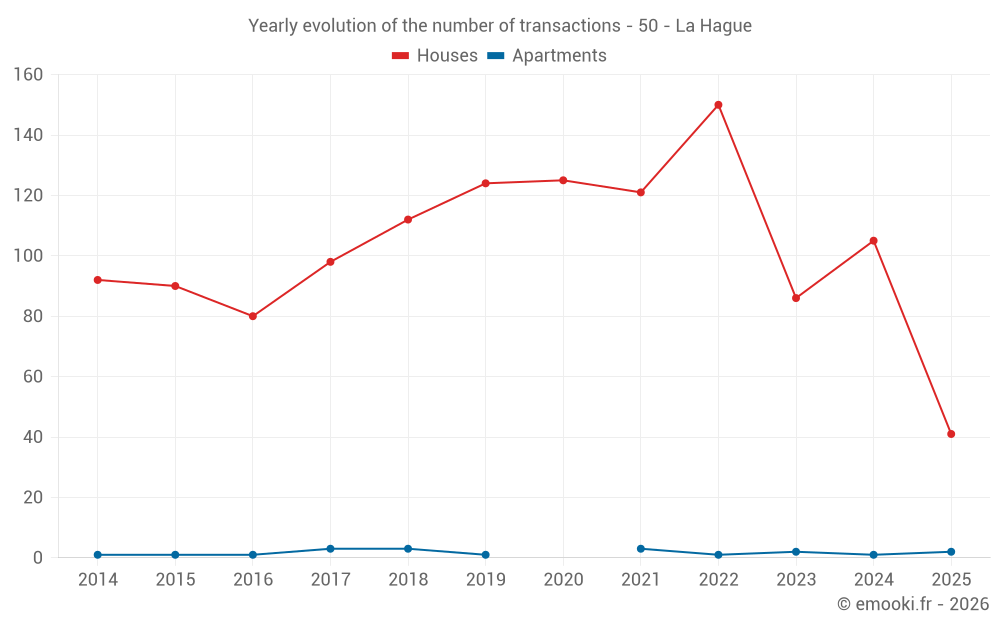
Yearly evolution of the number of transactions
Warning, last year incomplete. Projections made based on the proportions between semesters of the previous year at the departmental/national level and by type of property.
Yearly table
transactions
Price per m²
transactions
Price per m²
Analysis
Structure of prices per m²
Values of price percentiles per m² over the periods used for the estimated price of each type of property.
Structure of transaction amounts
Values of transaction amounts percentiles over the periods used for the estimated price of each type of property.
Transaction amounts and prices per m² by percentile
Price per m²
Transaction amount
Price per m²
Transaction amount
National and departmental comparison
Evolution of the median price per m² of houses
Evolution of the median price per m² of apartments
Quarterly data
Quarterly evolution of the median price per m²
Quarterly evolution of the number of transactions
Quarterly table
transactions
Price per m²
transactions
Price per m²
Key takeaways
What is the price per m2 of houses in La Hague?
The median price on the 21 house transactions of the last 3 months in the municipality of La Hague was 2 443 € per square meter for a median property value of 226 000 €. Over this period, 60% of transactions were between 1 808 and 3 802 € per square meter (from the 2nd to the 8th deciles).
Compare with neighboring municipalities
name
Price per m²
Price per m²
City information
Zip codes
- ACQUEVILLE 50440 LA HAGUE
- AUDERVILLE 50440 LA HAGUE
- BEAUMONT HAGUE 50440 LA HAGUE
- BIVILLE 50440 LA HAGUE
- BRANVILLE HAGUE 50440 LA HAGUE
- DIGULLEVILLE 50440 LA HAGUE
- ECULLEVILLE 50440 LA HAGUE
- GREVILLE HAGUE 50440 LA HAGUE
- HERQUEVILLE 50440 LA HAGUE
- JOBOURG 50440 LA HAGUE
- OMONVILLE LA PETITE 50440 LA HAGUE
- OMONVILLE LA ROGUE 50440 LA HAGUE
- STE CROIX HAGUE 50440 LA HAGUE
- ST GERMAIN DES VAUX 50440 LA HAGUE
- VASTEVILLE 50440 LA HAGUE
- VAUVILLE 50440 LA HAGUE
- TONNEVILLE 50460 LA HAGUE
- URVILLE NACQUEVILLE 50460 LA HAGUE
- FLOTTEMANVILLE HAGUE 50690 LA HAGUE