Real estate price map
Real estate price map in the municipality of Segré-en-Anjou Bleu, choose a section to see transactions by parcel.
Price per m² in Segré-en-Anjou Bleu
Median price of real estate
in the municipality of Segré-en-Anjou Bleu
1 941 € /m²
1 878 € /m²
1 889 € /m²
4243 transactions listed in the municipality
Yearly data
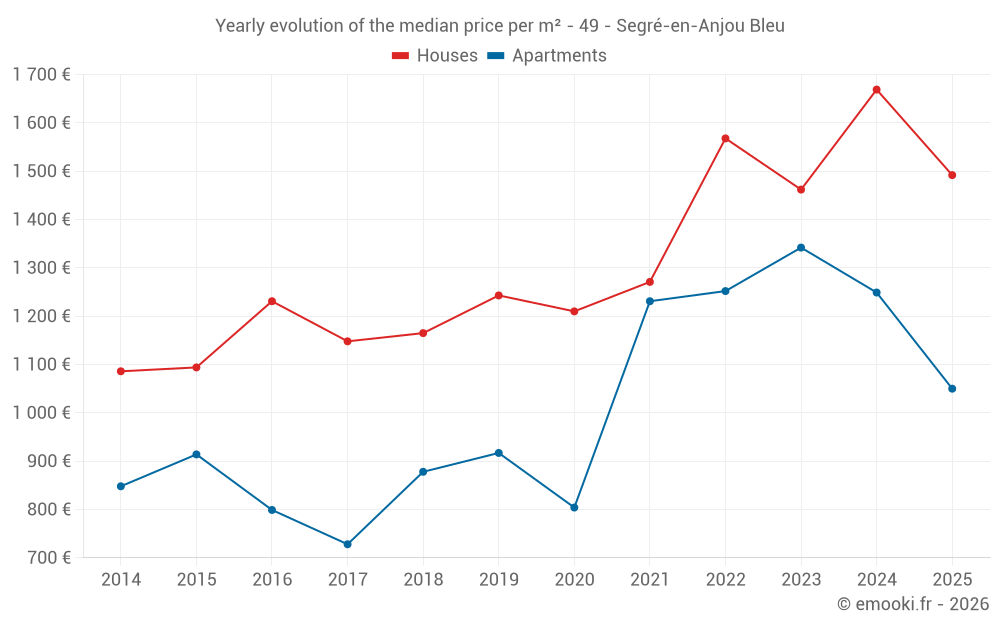
Yearly evolution of the median price per m²
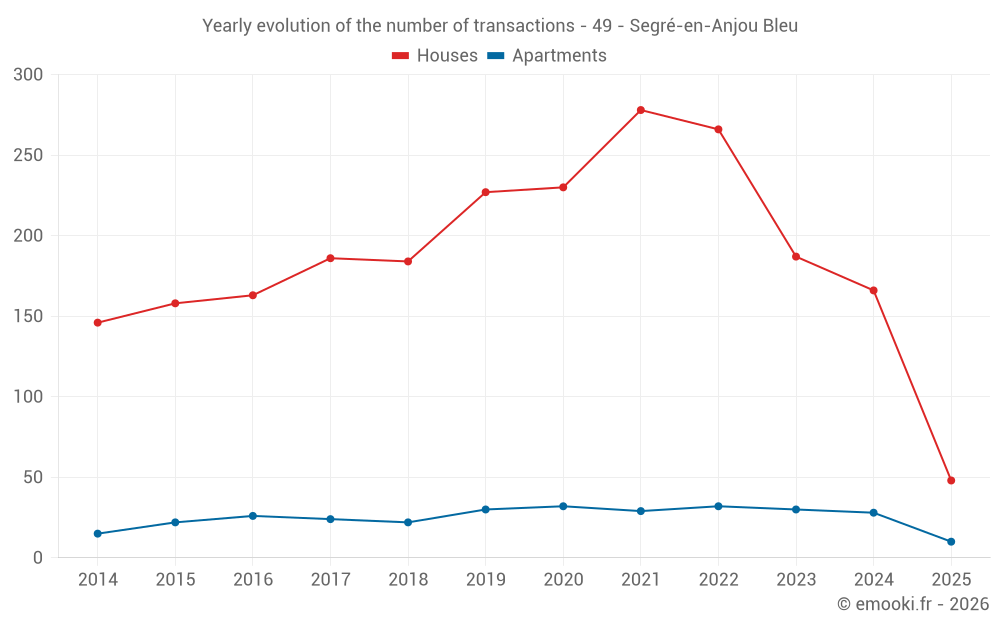
Yearly evolution of the number of transactions
Warning, last year incomplete. Projections made based on the proportions between semesters of the previous year at the departmental/national level and by type of property.
Yearly table
transactions
Price per m²
transactions
Price per m²
Analysis
Structure of prices per m²
Values of price percentiles per m² over the periods used for the estimated price of each type of property.
Structure of transaction amounts
Values of transaction amounts percentiles over the periods used for the estimated price of each type of property.
Transaction amounts and prices per m² by percentile
Price per m²
Transaction amount
Price per m²
Transaction amount
National and departmental comparison
Evolution of the median price per m² of houses
Evolution of the median price per m² of apartments
Quarterly data
Quarterly evolution of the median price per m²
Quarterly evolution of the number of transactions
Quarterly table
transactions
Price per m²
transactions
Price per m²
Key takeaways
What is the price per m2 of houses in Segré-en-Anjou Bleu?
The median price on the 48 house transactions of the last 6 months in the municipality of Segré-en-Anjou Bleu was 1 492 € per square meter for a median property value of 142 584 €. Over this period, 60% of transactions were between 1 132 and 1 941 € per square meter (from the 2nd to the 8th deciles).
What is the price per m2 of apartments in Segré-en-Anjou Bleu?
The median price on the 26 apartment transactions of the last 12 months in the municipality of Segré-en-Anjou Bleu was 1 174 € per square meter for a median property value of 83 840 €. Over this period, 60% of transactions were between 899 and 1 878 € per square meter (from the 2nd to the 8th deciles).
Compare with neighboring municipalities
name
Price per m²
Price per m²
City information
Zip codes
- AVIRE 49500 SEGRE EN ANJOU BLEU
- LA CHAPELLE SUR OUDON 49500 SEGRE EN ANJOU BLEU
- LA FERRIERE DE FLEE 49500 SEGRE EN ANJOU BLEU
- L HOTELLERIE DE FLEE 49500 SEGRE EN ANJOU BLEU
- LOUVAINES 49500 SEGRE EN ANJOU BLEU
- MARANS 49500 SEGRE EN ANJOU BLEU
- MONTGUILLON 49500 SEGRE EN ANJOU BLEU
- NYOISEAU 49500 SEGRE EN ANJOU BLEU
- SEGRE 49500 SEGRE EN ANJOU BLEU
- STE GEMMES D ANDIGNE 49500 SEGRE EN ANJOU BLEU
- ST MARTIN DU BOIS 49500 SEGRE EN ANJOU BLEU
- ST SAUVEUR DE FLEE 49500 SEGRE EN ANJOU BLEU
- CHATELAIS 49520 SEGRE EN ANJOU BLEU
- LE BOURG D IRE 49520 SEGRE EN ANJOU BLEU
- NOYANT LA GRAVOYERE 49520 SEGRE EN ANJOU BLEU