emooki
HomePrice mapTransactions
🇬🇧 English🇫🇷 Français🇩🇪 Deutsch🇪🇸 Español🇮🇹 Italiano

Real estate price map


Real estate price map in the municipality of Les Garennes sur Loire, choose a section to see transactions by parcel.

Maine-et-Loire (49)

Les Garennes sur Loire - Real estate price m²

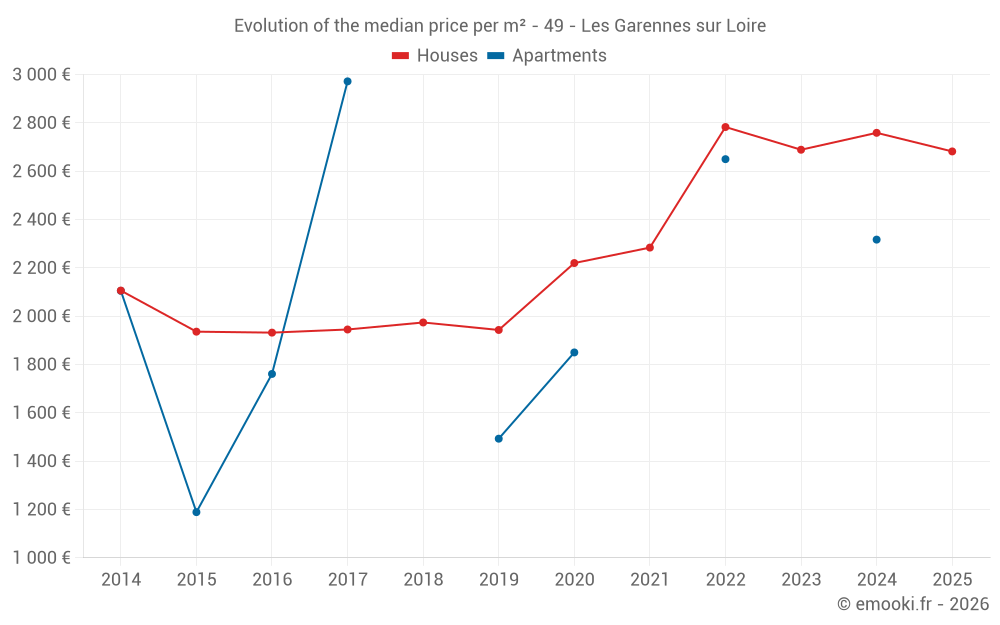
Median price of real estate
in the municipality of Les Garennes sur Loire

HousesHouses
2 814  /m²
1-23-45-67-89-10
Reliability 8/10
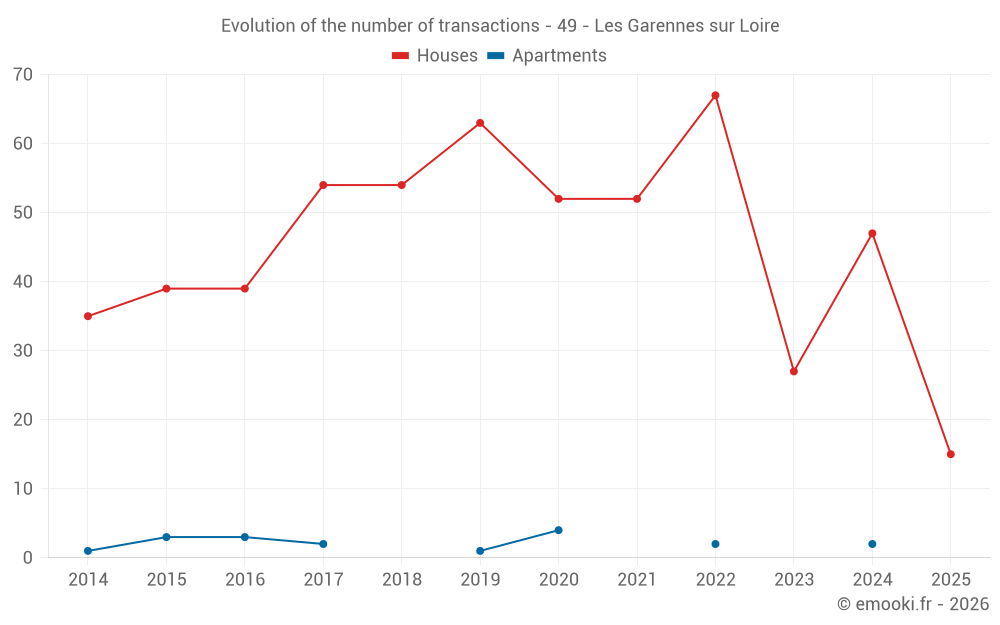
Median price on the 37 transactions of the last 12 months.
from 2 262 to
3 356  /m²
60% of transactions from the 2nd to the 8th deciles.
ApartmentsApartments
2 188  /m²
1-23-45-67-89-10
Reliability 3/10
Median price on the 8 transactions of the last 72 months.
DwellingsDwellings
2 814  /m²
1-23-45-67-89-10
Reliability 8/10
Median price on the 39 transactions of the last 12 months.
from 2 195 to
3 330  /m²
60% of transactions from the 2nd to the 8th deciles.
HousesEvolution of the price per m² of houses since...
1 year
-2.8%
2 years
-0.3%
3 years
-3.6%
4 years
+17%
5 years
+21%
6 years
+38%
7 years
+36%
8 years
+38%
9 years
+39%
10 years
+39%
11 years
+27%
The price per m² of houses has decreased by 3.6% since 3 years, but it has increased by 39% in 9 years.

Yearly evolution

Evolution of the median price per m²

Evolution of the median price per m² - 49 - Les Garennes sur Loire

Evolution of the number of transactions

Warning, last year incomplete. Projections made based on the proportions between semesters of the previous year at the departmental/national level and by type of property.

Evolution of the number of transactions - 49 - Les Garennes sur Loire

Yearly data

Descending order
Year
Houses
house
transactions
Houses
house
Price per m²
Apartments
apt.
transactions
Apartments
apt.
Price per m²
2025
15
2 682 
0
--- 
2024
47
2 759 
2
2 317 
2023
27
2 689 
0
--- 
2022
67
2 783 
2
2 650 
2021
52
2 284 
0
--- 
2020
52
2 220 
4
1 850 
2019
63
1 943 
1
1 493 
2018
54
1 974 
0
--- 
2017
54
1 945 
2
2 972 
2016
39
1 932 
3
1 761 
2015
39
1 936 
3
1 189 
2014
35
2 106 
1
2 105 

Analysis

Structure of prices per m²

Values of price percentiles per m² over the periods used for the estimated price of each type of property.

Structure of transaction amounts

Values of transaction amounts percentiles over the periods used for the estimated price of each type of property.

Transaction amounts and prices per m² by percentile

Ascending order
Percentile
Houses
house
Price per m²
Houses
house
Transaction amount
Apartments
apt.
Price per m²
Apartments
apt.
Transaction amount
10th percentile
1 752 
211 K
1 269 
125 K
20th percentile
2 262 
247 K
1 687 
135 K
30th percentile
2 468 
274 K
1 845 
141 K
40th percentile
2 659 
300 K
2 044 
144 K
50th percentile
2 814 
340 K
2 188 
155 K
60th percentile
2 920 
352 K
2 311 
168 K
70th percentile
3 049 
413 K
2 438 
180 K
80th percentile
3 356 
436 K
2 673 
193 K
90th percentile
3 823 
561 K
2 825 
212 K

National and departmental comparison

Evolution of the median price per m² of houses

Evolution of the median price per m² of apartments

Quarterly evolution

Evolution of the median price per m²

Evolution of the number of transactions

Quarterly data

Descending order
Quarter
Houses
house
transactions
Houses
house
Price per m²
Apartments
apt.
transactions
Apartments
apt.
Price per m²
2025 Q2
4
3 026 
0
--- 
2025 Q1
11
2 594 
0
--- 
2024 Q4
11
2 663 
2
2 317 
2024 Q3
11
2 884 
0
--- 
2024 Q2
12
2 902 
0
--- 
2024 Q1
13
2 512 
0
--- 
2023 Q4
5
2 813 
0
--- 
2023 Q3
5
2 817 
0
--- 
2023 Q2
10
2 476 
0
--- 
2023 Q1
7
2 951 
0
--- 
2022 Q4
12
3 086 
1
2 845 
2022 Q3
23
2 969 
1
2 456 
2022 Q2
16
2 638 
0
--- 
2022 Q1
16
2 502 
0
--- 
2021 Q4
13
2 275 
0
--- 
2021 Q3
13
2 330 
0
--- 
2021 Q2
18
2 314 
0
--- 
2021 Q1
8
2 131 
0
--- 
2020 Q4
16
2 650 
1
1 600 
2020 Q3
10
2 570 
1
2 275 
2020 Q2
16
2 032 
0
--- 
2020 Q1
10
2 005 
2
1 298 
2019 Q4
17
1 962 
0
--- 
2019 Q3
16
2 214 
0
--- 
2019 Q2
15
1 897 
0
--- 
2019 Q1
15
1 888 
1
1 493 
2018 Q4
12
2 067 
0
--- 
2018 Q3
13
1 984 
0
--- 
2018 Q2
17
1 683 
0
--- 
2018 Q1
12
1 955 
0
--- 
2017 Q4
9
1 918 
1
3 661 
2017 Q3
17
2 000 
0
--- 
2017 Q2
14
2 025 
0
--- 
2017 Q1
14
1 918 
1
2 284 
2016 Q4
7
1 932 
0
--- 
2016 Q3
13
1 770 
2
1 816 
2016 Q2
9
1 842 
0
--- 
2016 Q1
10
1 982 
1
1 761 
2015 Q4
11
1 927 
3
1 189 
2015 Q3
12
2 312 
0
--- 
2015 Q2
5
1 610 
0
--- 
2015 Q1
11
1 854 
0
--- 
2014 Q4
7
2 106 
0
--- 
2014 Q3
14
2 307 
1
2 105 
2014 Q2
11
1 849 
0
--- 
2014 Q1
3
1 962 
0
--- 

Overview of the latest real estate transactions

The following list is an anonymized overview of the latest transactions. For more details and to find all transactions, please use the map to view transactions by plot or the transaction search page for a search by criteria.

2025-05-30
286 000 
Sale
Land
3222 m2
-Terrains à bâtir
2025-05-26
480 000 
2 682  /m²(179 m²)
Sale
Houses
House
6 rooms
179 m2
1 outbuilding
Land
508 m2
-Sols
Land
1767 m2
-Terrains d'agrément
Land
655 m2
-Jardins
/Jardin potager
Land
510 m2
-Sols
2025-04-29
372 000 
2 657  /m²(140 m²)
Sale
Houses
House
5 rooms
140 m2
Land
311 m2
-Sols
2025-04-24
340 000 
3 579  /m²(95 m²)
Sale
Houses
House
5 rooms
95 m2
Land
445 m2
-Sols
2025-04-17
8 000 
Sale
Land
3811 m2
-Vignes
Land
8592 m2
-Vignes
Land
2360 m2
-Terres
2025-04-10
179 000 
Sale
Land
679 m2
-Terrains à bâtir
2025-04-10
475 000 
3 369  /m²(141 m²)
Sale
Houses
House
5 rooms
141 m2
Land
1140 m2
-Sols
Land
3136 m2
-Terrains d'agrément
2025-04-09
1 970 
Sale
Land
1661 m2
-Taillis simples
Land
120 m2
-Vignes
Land
2123 m2
-Vignes
Land
2661 m2
-Terres
2025-04-09
764 
Sale
Land
1231 m2
-Terres
Land
715 m2
-Terres
Land
599 m2
-Taillis simples
2025-04-07
1 100 
Sale
Land
3781 m2
-Terres
2025-03-27
295 000 
2 398  /m²(123 m²)
Sale
Houses
House
5 rooms
123 m2
Land
900 m2
-Sols
2025-03-22
354 100 
2 146  /m²(165 m²)
Sale
Houses
House
7 rooms
165 m2
Land
500 m2
-Sols
Land
822 m2
-Terrains d'agrément
Land
2574 m2
-Terrains d'agrément
Land
33 m2
-Sols
Land
1 m2
-Sols
2025-03-06
330 000 
1 104  /m²(299 m²)
Sale
Commercial property
299 m2
Land
1014 m2
-Sols
2025-03-06
834 596 
Sale
Land
262 m2
-Terrains à bâtir
Land
279 m2
-Terrains à bâtir
Land
294 m2
-Terrains à bâtir
Land
310 m2
-Terrains à bâtir
2025-03-06
430 000 
3 007  /m²(143 m²)
Sale
Houses
House
5 rooms
143 m2
2 outbuildings
Land
620 m2
-Sols
Land
153 m2
-Prés
Land
1266 m2
-Jardins
/Jardin potager
Land
886 m2
-Terrains d'agrément
2025-03-06
1 254 106 
Sale
Land
401 m2
-Terrains à bâtir
Land
345 m2
-Terrains à bâtir
Land
347 m2
-Terrains à bâtir
Land
346 m2
-Terrains à bâtir
Land
344 m2
-Terrains à bâtir
Land
406 m2
-Terrains à bâtir
2025-03-06
80 952 
Sale
Land
150 m2
-Sols
2025-03-03
2 000 
Sale
Land
737 m2
-Vergers
/Vergers de plein vent
2025-02-26
420 000 
2 471  /m²(170 m²)
Sale
Houses
House
4 rooms
170 m2
3 outbuildings
Land
1450 m2
-Prés
Land
2000 m2
-Sols
Land
1540 m2
-Prés
2025-02-26
273 911 
Sale
Land
401 m2
-Terrains à bâtir
Land
345 m2
-Terrains à bâtir
Land
347 m2
-Terrains à bâtir
Land
346 m2
-Terrains à bâtir
Land
344 m2
-Terrains à bâtir
Land
406 m2
-Terrains à bâtir
Land
262 m2
-Terrains à bâtir
Land
279 m2
-Terrains à bâtir
Land
294 m2
-Terrains à bâtir
Land
310 m2
-Terrains à bâtir
1160 transactions listed in the municipality

Maine-et-Loire (49)

Most expensive cities

City
name
Descending orderHouses
house
Price per m²
3 368 
2 990 
2 863 
2 738 
2 666 
City
name
Descending orderApartments
apt.
Price per m²
3 544 
3 331 
3 200 
2 892 
2 770 
2 728 
2 634 
2 576 

Least expensive cities

City
name
Ascending orderHouses
house
Price per m²
783 
961 
1 016 
1 026 
1 035 
1 048 
City
name
Ascending orderApartments
apt.
Price per m²
123 
208 
382 
441 
478