Real estate price map
Real estate price map in the municipality of Mauges-sur-Loire, choose a section to see transactions by parcel.
Price per m² in Mauges-sur-Loire
Median price of real estate
in the municipality of Mauges-sur-Loire
2 293 € /m²
1 539 € /m²
2 264 € /m²
4583 transactions listed in the municipality
Yearly data
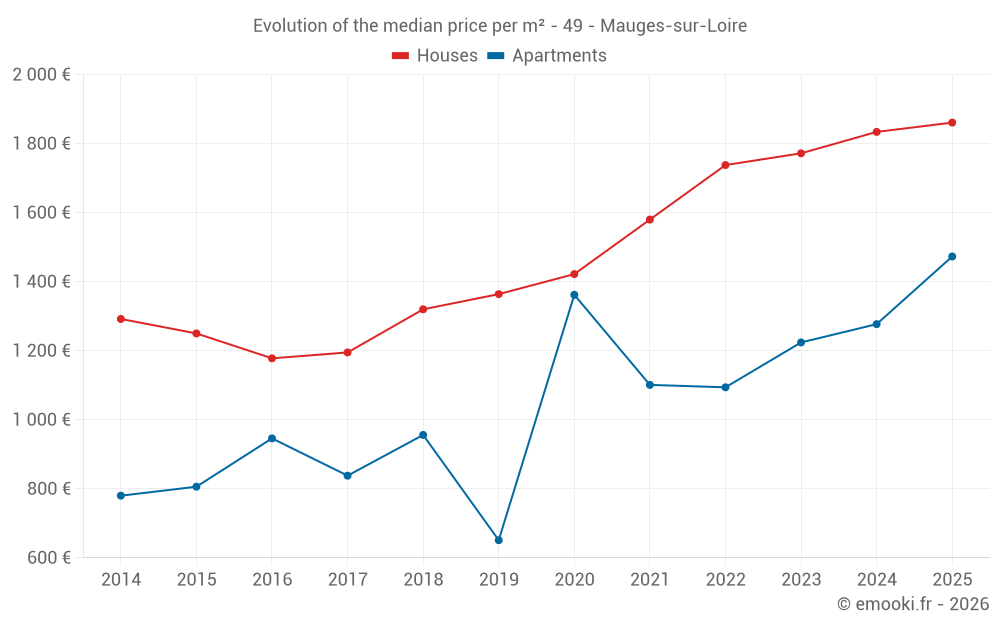
Yearly evolution of the median price per m²
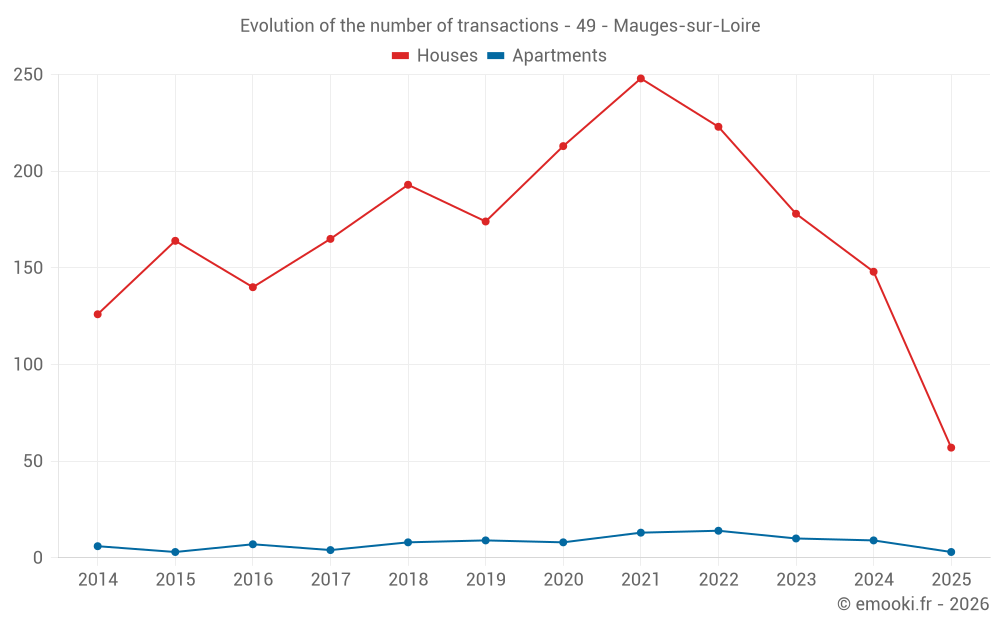
Yearly evolution of the number of transactions
Warning, last year incomplete. Projections made based on the proportions between semesters of the previous year at the departmental/national level and by type of property.
Yearly table
transactions
Price per m²
transactions
Price per m²
Analysis
Structure of prices per m²
Values of price percentiles per m² over the periods used for the estimated price of each type of property.
Structure of transaction amounts
Values of transaction amounts percentiles over the periods used for the estimated price of each type of property.
Transaction amounts and prices per m² by percentile
Price per m²
Transaction amount
Price per m²
Transaction amount
National and departmental comparison
Evolution of the median price per m² of houses
Evolution of the median price per m² of apartments
Quarterly data
Quarterly evolution of the median price per m²
Quarterly evolution of the number of transactions
Quarterly table
transactions
Price per m²
transactions
Price per m²
Key takeaways
What is the price per m2 of houses in Mauges-sur-Loire?
The median price on the 57 house transactions of the last 6 months in the municipality of Mauges-sur-Loire was 1 861 € per square meter for a median property value of 156 000 €. Over this period, 60% of transactions were between 1 401 and 2 293 € per square meter (from the 2nd to the 8th deciles).
What is the price per m2 of apartments in Mauges-sur-Loire?
The median price on the 14 apartment transactions of the last 24 months in the municipality of Mauges-sur-Loire was 1 318 € per square meter for a median property value of 125 000 €. Over this period, 60% of transactions were between 1 066 and 1 539 € per square meter (from the 2nd to the 8th deciles).
Compare with neighboring municipalities
name
Price per m²
Price per m²
City information
Zip codes
- BOTZ EN MAUGES 49110 MAUGES SUR LOIRE
- BOURGNEUF EN MAUGES 49290 MAUGES SUR LOIRE
- ST LAURENT DE LA PLAINE 49290 MAUGES SUR LOIRE
- BEAUSSE 49410 MAUGES SUR LOIRE
- LA CHAPELLE ST FLORENT 49410 MAUGES SUR LOIRE
- LE MARILLAIS 49410 MAUGES SUR LOIRE
- LE MESNIL EN VALLEE 49410 MAUGES SUR LOIRE
- ST FLORENT LE VIEIL 49410 MAUGES SUR LOIRE
- ST LAURENT DU MOTTAY 49410 MAUGES SUR LOIRE
- MONTJEAN SUR LOIRE 49570 MAUGES SUR LOIRE
- LA POMMERAYE 49620 MAUGES SUR LOIRE