Real estate price map
Real estate price map in the municipality of Beaupréau-en-Mauges, choose a section to see transactions by parcel.
Price per m² in Beaupréau-en-Mauges
Median price of real estate
in the municipality of Beaupréau-en-Mauges
2 285 € /m²
1 939 € /m²
2 258 € /m²
5594 transactions listed in the municipality
Yearly data
Yearly evolution of the median price per m²

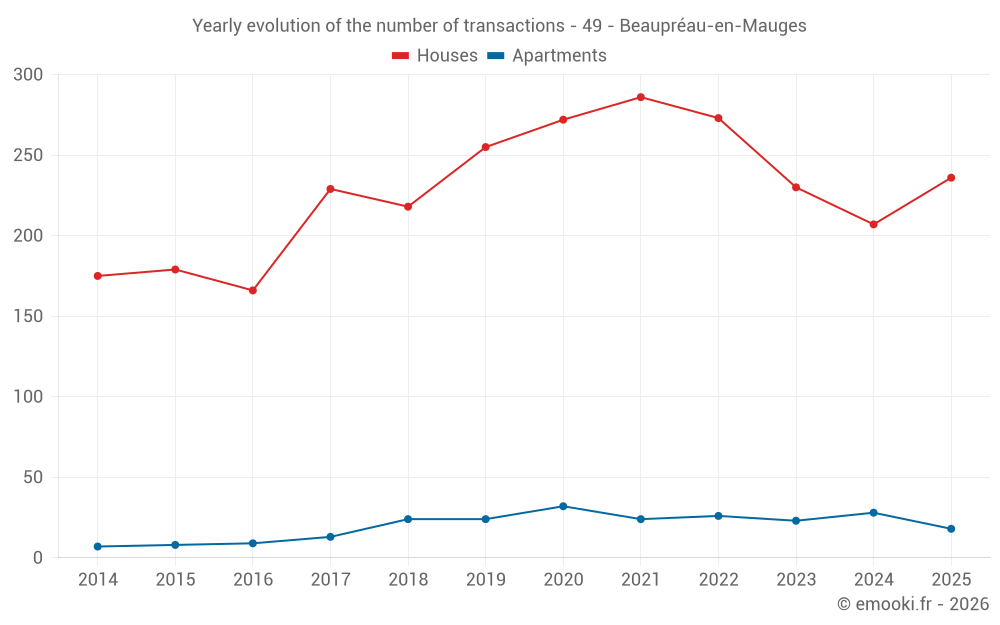
Yearly evolution of the number of transactions
Yearly table
transactions
Price per m²
transactions
Price per m²
Analysis
Structure of prices per m²
Values of price percentiles per m² over the periods used for the estimated price of each type of property.
Structure of transaction amounts
Values of transaction amounts percentiles over the periods used for the estimated price of each type of property.
Transaction amounts and prices per m² by percentile
Price per m²
Transaction amount
Price per m²
Transaction amount
National and departmental comparison
Evolution of the median price per m² of houses
Evolution of the median price per m² of apartments
Quarterly data
Quarterly evolution of the median price per m²
Quarterly evolution of the number of transactions
Quarterly table
transactions
Price per m²
transactions
Price per m²
Key takeaways
What is the price per m2 of houses in Beaupréau-en-Mauges?
The median price on the 57 house transactions of the last 3 months in the municipality of Beaupréau-en-Mauges was 1 750 € per square meter for a median property value of 165 825 €. Over this period, 60% of transactions were between 1 315 and 2 285 € per square meter (from the 2nd to the 8th deciles).
What is the price per m2 of apartments in Beaupréau-en-Mauges?
The median price on the 18 apartment transactions of the last 12 months in the municipality of Beaupréau-en-Mauges was 1 464 € per square meter for a median property value of 109 600 €. Over this period, 60% of transactions were between 1 305 and 1 939 € per square meter (from the 2nd to the 8th deciles).
Compare with neighboring municipalities
name
Price per m²
Price per m²
City information
Zip codes
- LE PIN EN MAUGES 49110 BEAUPREAU EN MAUGES
- VILLEDIEU LA BLOUERE 49450 BEAUPREAU EN MAUGES
- JALLAIS 49510 BEAUPREAU EN MAUGES
- LA JUBAUDIERE 49510 BEAUPREAU EN MAUGES
- LA POITEVINIERE 49510 BEAUPREAU EN MAUGES
- ANDREZE 49600 BEAUPREAU EN MAUGES
- BEAUPREAU 49600 BEAUPREAU EN MAUGES
- GESTE 49600 BEAUPREAU EN MAUGES
- LA CHAPELLE DU GENET 49600 BEAUPREAU EN MAUGES
- ST PHILBERT EN MAUGES 49600 BEAUPREAU EN MAUGES