Median price of real estate
in the municipality of Longuenée-en-Anjou
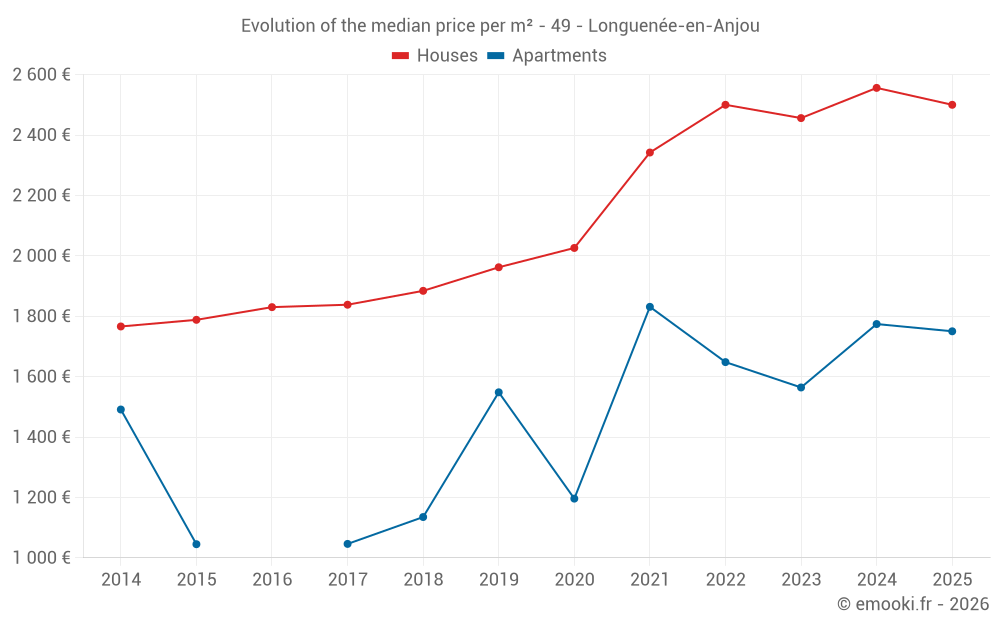
Houses
2 574 € /m²
Reliability 8/10
Median price on the 49 transactions of the last 12 months.
from 2 117 to
3 100 € /m²
3 100 € /m²
60% of transactions from the 2nd to the 8th deciles.
Apartments
1 714 € /m²
Reliability 5/10
Median price on the 14 transactions of the last 48 months.
from 1 519 to
1 943 € /m²
1 943 € /m²
60% of transactions from the 2nd to the 8th deciles.
Dwellings
2 426 € /m²
Reliability 9/10
Median price on the 18 transactions of the last 6 months.
from 1 894 to
3 127 € /m²
3 127 € /m²
60% of transactions from the 2nd to the 8th deciles.