Median price of real estate
in the municipality of Geneston
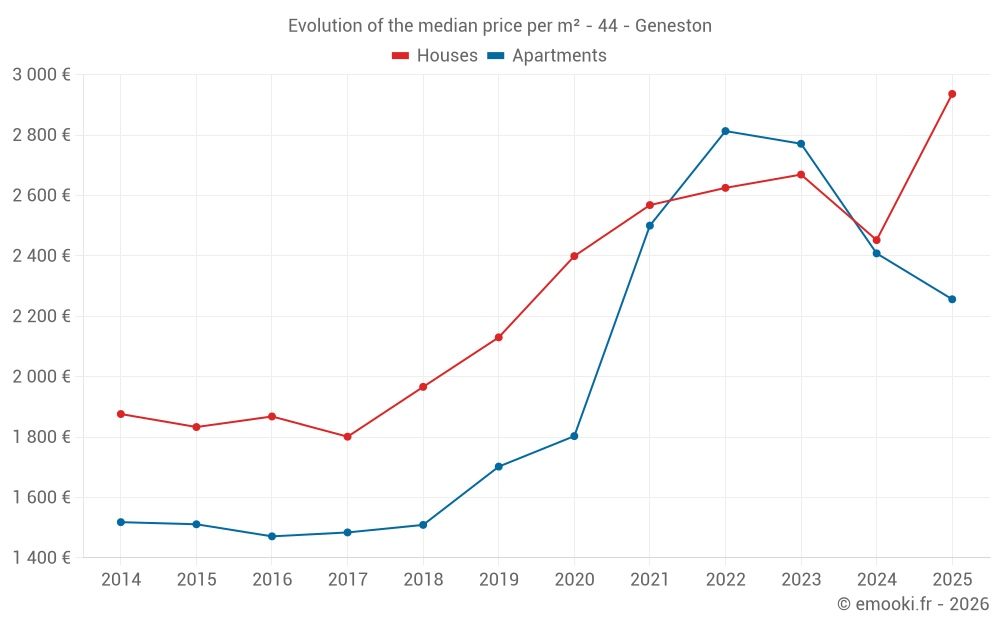
Houses
2 519 € /m²
Reliability 8/10
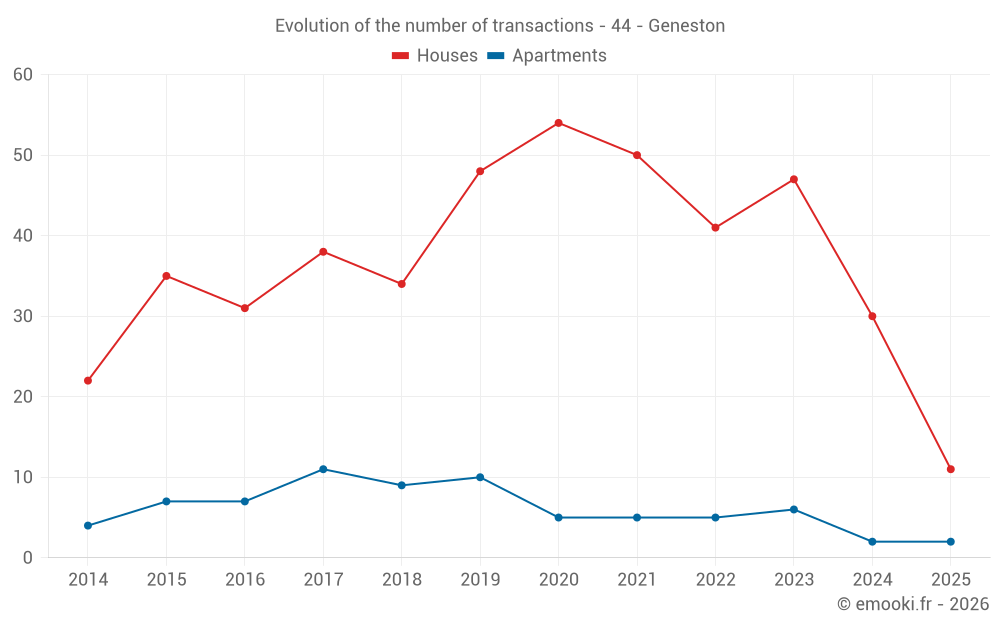
Median price on the 30 transactions of the last 12 months.
from 1 952 to
3 126 € /m²
3 126 € /m²
60% of transactions from the 2nd to the 8th deciles.
Apartments
2 667 € /m²
Reliability 5/10
Median price on the 17 transactions of the last 48 months.
from 2 307 to
2 854 € /m²
2 854 € /m²
60% of transactions from the 2nd to the 8th deciles.
Dwellings
2 437 € /m²
Reliability 8/10
Median price on the 33 transactions of the last 12 months.
from 2 044 to
3 080 € /m²
3 080 € /m²
60% of transactions from the 2nd to the 8th deciles.