emooki
HomePrice mapTransactions
🇬🇧 English🇫🇷 Français🇩🇪 Deutsch🇪🇸 Español🇮🇹 Italiano

Real estate price map


Real estate price map in the municipality of Les Sorinières.

Loire-Atlantique (44)
Les Sorinières

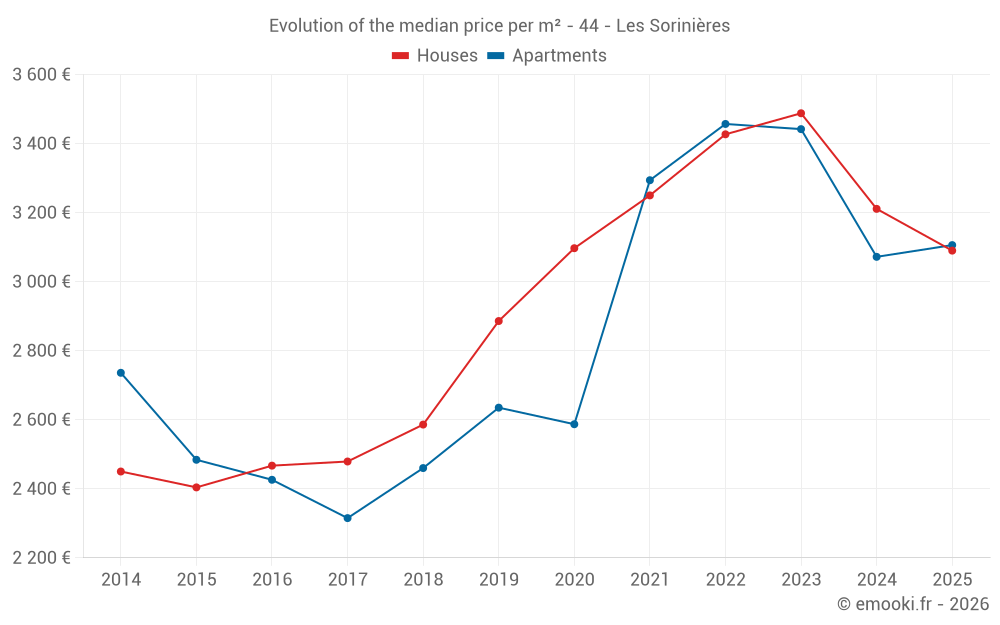
Median price of real estate
in the municipality of Les Sorinières

HousesHouses
3 090  /m²
1-23-45-67-89-10
Reliability 9/10
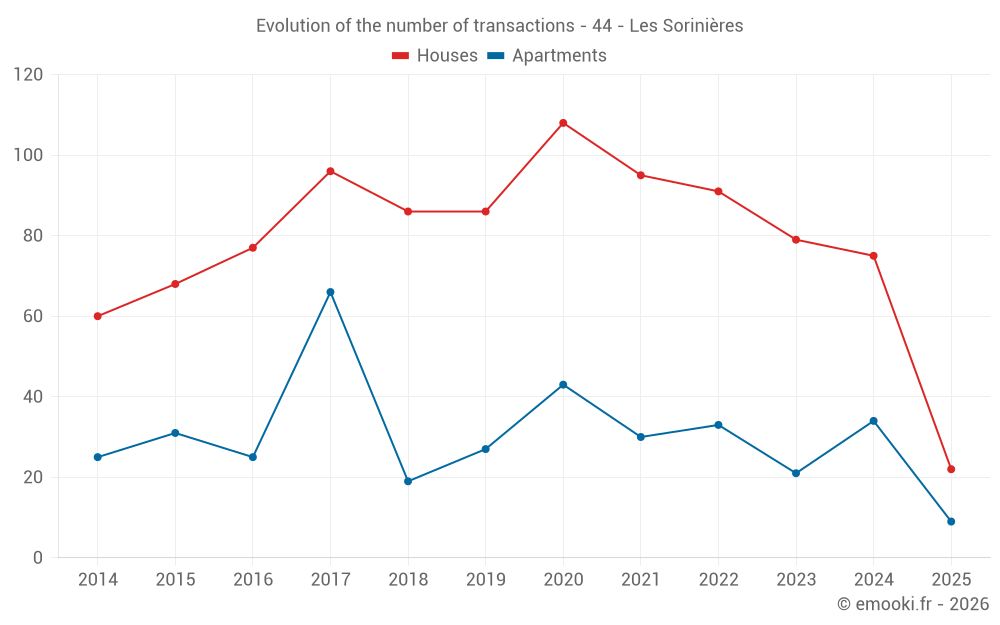
Median price on the 22 transactions of the last 6 months.
from 2 537 to
3 541  /m²
60% of transactions from the 2nd to the 8th deciles.
ApartmentsApartments
3 106  /m²
1-23-45-67-89-10
Reliability 8/10
Median price on the 29 transactions of the last 12 months.
from 2 530 to
3 407  /m²
60% of transactions from the 2nd to the 8th deciles.
DwellingsDwellings
3 106  /m²
1-23-45-67-89-10
Reliability 9/10
Median price on the 31 transactions of the last 6 months.
from 2 519 to
3 519  /m²
60% of transactions from the 2nd to the 8th deciles.
HousesEvolution of the price per m² of houses since...
1 year
-3.8%
2 years
-11%
3 years
-10%
4 years
-4.9%
5 years
-0.2%
6 years
+7.1%
7 years
+19%
8 years
+25%
9 years
+25%
10 years
+29%
11 years
+26%
ApartmentsEvolution of the price per m² of apartments since...
1 year
+1.1%
2 years
-10%
3 years
-10%
4 years
-5.7%
5 years
+20%
6 years
+18%
7 years
+26%
8 years
+34%
9 years
+28%
10 years
+25%
11 years
+14%

Yearly evolution

Evolution of the median price per m²

Evolution of the number of transactions

Warning, last year incomplete. Projections made based on the proportions between semesters of the previous year at the departmental/national level and by type of property.

Yearly data

Descending order
Year
Houses
house
transactions
Houses
house
Price per m²
Apartments
apt.
transactions
Apartments
apt.
Price per m²
2025
22
3 090 
9
3 106 
2024
75
3 211 
34
3 072 
2023
79
3 488 
21
3 442 
2022
91
3 427 
33
3 457 
2021
95
3 250 
30
3 294 
2020
108
3 097 
43
2 587 
2019
86
2 886 
27
2 635 
2018
86
2 586 
19
2 460 
2017
96
2 479 
66
2 315 
2016
77
2 467 
25
2 426 
2015
68
2 404 
31
2 484 
2014
60
2 450 
25
2 736 

Analysis

Structure of prices per m²

Values of price percentiles per m² over the periods used for the estimated price of each type of property.

Structure of transaction amounts

Values of transaction amounts percentiles over the periods used for the estimated price of each type of property.

Transaction amounts and prices per m² by percentile

Ascending order
Percentile
Houses
house
Price per m²
Houses
house
Transaction amount
Apartments
apt.
Price per m²
Apartments
apt.
Transaction amount
10th percentile
2 456 
221 K
2 427 
112 K
20th percentile
2 537 
243 K
2 530 
129 K
30th percentile
2 818 
266 K
2 717 
141 K
40th percentile
3 041 
284 K
3 029 
144 K
50th percentile
3 090 
308 K
3 106 
150 K
60th percentile
3 170 
335 K
3 127 
177 K
70th percentile
3 333 
351 K
3 248 
200 K
80th percentile
3 541 
367 K
3 407 
218 K
90th percentile
3 676 
489 K
3 509 
223 K

National and departmental comparison

Evolution of the median price per m² of houses

Evolution of the median price per m² of apartments

Quarterly evolution

Evolution of the median price per m²

Evolution of the number of transactions

Quarterly data

Descending order
Quarter
Houses
house
transactions
Houses
house
Price per m²
Apartments
apt.
transactions
Apartments
apt.
Price per m²
2025 Q2
6
2 875 
2
3 040 
2025 Q1
16
3 090 
7
3 106 
2024 Q4
23
3 119 
8
3 143 
2024 Q3
20
3 527 
12
2 802 
2024 Q2
22
2 896 
11
3 118 
2024 Q1
10
3 272 
3
3 041 
2023 Q4
9
3 561 
3
3 927 
2023 Q3
17
3 699 
6
3 180 
2023 Q2
22
3 272 
7
3 346 
2023 Q1
31
3 269 
5
3 510 
2022 Q4
22
3 048 
3
3 409 
2022 Q3
26
3 638 
10
3 576 
2022 Q2
18
3 558 
12
3 551 
2022 Q1
25
3 220 
8
3 259 
2021 Q4
16
3 738 
11
3 373 
2021 Q3
28
3 294 
5
3 158 
2021 Q2
31
3 095 
8
2 848 
2021 Q1
20
3 086 
6
3 340 
2020 Q4
37
3 132 
10
3 318 
2020 Q3
25
2 866 
8
2 573 
2020 Q2
19
3 333 
3
2 588 
2020 Q1
27
3 095 
22
2 506 
2019 Q4
24
3 099 
8
2 984 
2019 Q3
29
2 807 
2
2 564 
2019 Q2
14
2 991 
6
2 376 
2019 Q1
19
2 714 
11
2 580 
2018 Q4
20
2 761 
2
2 348 
2018 Q3
14
2 684 
4
2 458 
2018 Q2
26
2 409 
9
2 667 
2018 Q1
26
2 552 
4
2 486 
2017 Q4
20
2 362 
31
2 311 
2017 Q3
28
2 818 
25
2 313 
2017 Q2
28
2 413 
5
2 476 
2017 Q1
20
2 472 
5
2 583 
2016 Q4
22
2 469 
8
2 366 
2016 Q3
23
2 483 
5
2 426 
2016 Q2
15
2 302 
4
2 368 
2016 Q1
17
2 295 
8
2 446 
2015 Q4
23
2 177 
9
2 394 
2015 Q3
20
2 603 
10
2 476 
2015 Q2
12
2 419 
7
2 545 
2015 Q1
13
2 500 
5
2 459 
2014 Q4
23
2 391 
6
2 626 
2014 Q3
11
2 407 
9
2 701 
2014 Q2
13
2 576 
5
2 780 
2014 Q1
13
2 292 
5
2 736 

Loire-Atlantique (44)

Most expensive cities

City
name
Descending orderHouses
house
Price per m²
5 313 
4 971 
4 956 
4 688 
4 625 
4 293 
4 255 
4 196 
City
name
Descending orderApartments
apt.
Price per m²
6 488 
5 441 
5 234 
5 158 
5 066 
4 590 

Least expensive cities

City
name
Ascending orderHouses
house
Price per m²
1 058 
1 071 
1 087 
1 178 
1 178 
1 275 
City
name
Ascending orderApartments
apt.
Price per m²
34 
146 
278 
483 
714 
727