emooki
HomePrice mapTransactions
🇬🇧 English🇫🇷 Français🇩🇪 Deutsch🇪🇸 Español🇮🇹 Italiano

Real estate price map


Real estate price map in the municipality of Saint-Herblain, choose a section to see transactions by parcel.

Loire-Atlantique (44)
Saint-Herblain

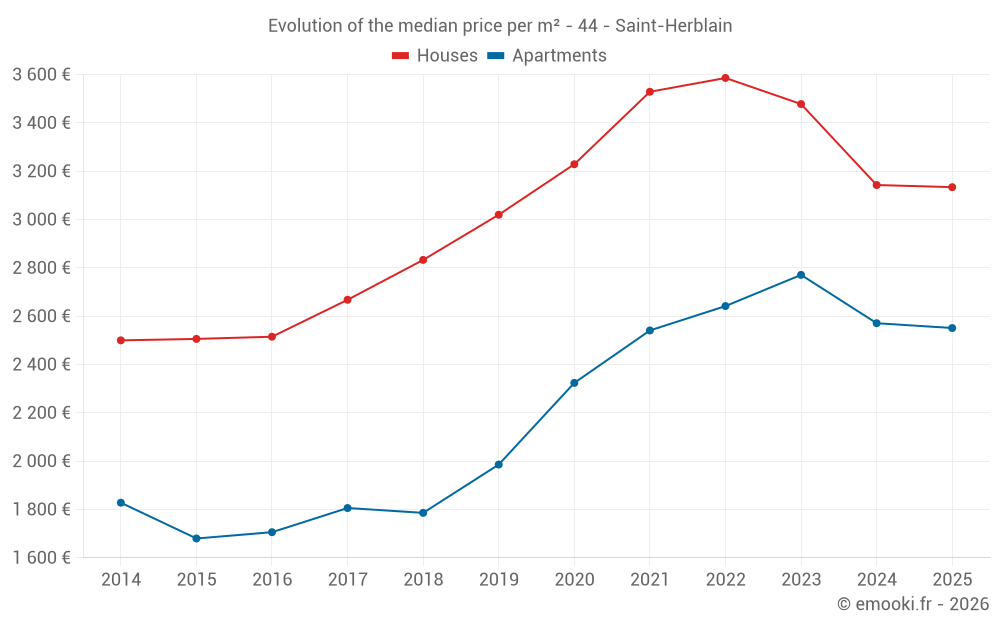
Median price of real estate
in the municipality of Saint-Herblain

HousesHouses
3 134 € /m²
1-23-45-67-89-10
Reliability 9/10
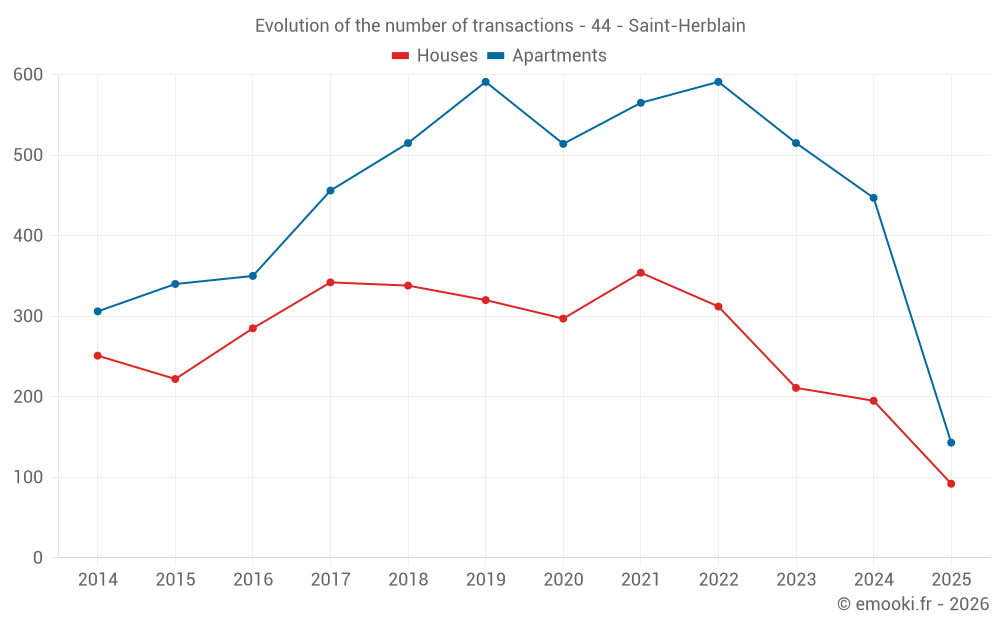
Median price on the 92 transactions of the last 6 months.
from 2 603 to
3 764 € /m²
60% of transactions from the 2nd to the 8th deciles.
ApartmentsApartments
2 530 € /m²
1-23-45-67-89-10
Reliability 10/10
Median price on the 35 transactions of the last 3 months.
from 1 744 to
3 347 € /m²
60% of transactions from the 2nd to the 8th deciles.
DwellingsDwellings
2 876 € /m²
1-23-45-67-89-10
Reliability 10/10
Median price on the 54 transactions of the last 3 months.
from 1 989 to
3 532 € /m²
60% of transactions from the 2nd to the 8th deciles.
HousesEvolution of the price per m² of houses since...
1 year
-0.3%
2 years
-10%
3 years
-13%
4 years
-11%
5 years
-2.9%
6 years
+3.8%
7 years
+11%
8 years
+17%
9 years
+25%
10 years
+25%
11 years
+25%
The price per m² of houses has decreased by 13% since 3 years, but it has increased by 25% in 11 years.
ApartmentsEvolution of the price per m² of apartments since...
1 year
-0.8%
2 years
-7.9%
3 years
-3.4%
4 years
+0.4%
5 years
+10%
6 years
+28%
7 years
+43%
8 years
+41%
9 years
+50%
10 years
+52%
11 years
+40%
The price per m² of apartments has decreased by 7.9% since 2 years, but it has increased by 52% in 10 years.

Yearly evolution

Evolution of the median price per m²

Evolution of the number of transactions

Warning, last year incomplete. Projections made based on the proportions between semesters of the previous year at the departmental/national level and by type of property.

Yearly data

Descending order
Year
Houses
house
transactions
Houses
house
Price per m²
Apartments
apt.
transactions
Apartments
apt.
Price per m²
2025
92
3 134 €
143
2 551 €
2024
195
3 143 €
447
2 571 €
2023
211
3 478 €
515
2 771 €
2022
312
3 586 €
591
2 642 €
2021
354
3 529 €
565
2 541 €
2020
297
3 229 €
514
2 324 €
2019
320
3 020 €
591
1 986 €
2018
338
2 833 €
515
1 786 €
2017
342
2 668 €
456
1 806 €
2016
285
2 515 €
350
1 706 €
2015
222
2 506 €
340
1 680 €
2014
251
2 500 €
306
1 828 €

Analysis

Structure of prices per m²

Values of price percentiles per m² over the periods used for the estimated price of each type of property.

Structure of transaction amounts

Values of transaction amounts percentiles over the periods used for the estimated price of each type of property.

Transaction amounts and prices per m² by percentile

Ascending order
Percentile
Houses
house
Price per m²
Houses
house
Transaction amount
Apartments
apt.
Price per m²
Apartments
apt.
Transaction amount
10th percentile
2 349 €
209 K€
1 529 €
67 060 €
20th percentile
2 603 €
239 K€
1 744 €
119 K€
30th percentile
2 797 €
252 K€
1 932 €
127 K€
40th percentile
2 928 €
270 K€
2 295 €
142 K€
50th percentile
3 134 €
282 K€
2 530 €
150 K€
60th percentile
3 333 €
300 K€
2 965 €
169 K€
70th percentile
3 484 €
329 K€
3 116 €
181 K€
80th percentile
3 764 €
375 K€
3 347 €
198 K€
90th percentile
4 057 €
416 K€
3 613 €
238 K€

National and departmental comparison

Evolution of the median price per m² of houses

Evolution of the median price per m² of apartments

Quarterly evolution

Evolution of the median price per m²

Evolution of the number of transactions

Quarterly data

Descending order
Quarter
Houses
house
transactions
Houses
house
Price per m²
Apartments
apt.
transactions
Apartments
apt.
Price per m²
2025 Q2
19
3 218 €
35
2 530 €
2025 Q1
73
3 095 €
108
2 616 €
2024 Q4
64
3 113 €
109
2 589 €
2024 Q3
55
3 218 €
137
2 583 €
2024 Q2
46
3 162 €
136
2 536 €
2024 Q1
30
3 219 €
65
2 517 €
2023 Q4
47
3 165 €
116
2 768 €
2023 Q3
64
3 591 €
134
2 800 €
2023 Q2
48
3 471 €
130
2 874 €
2023 Q1
52
3 612 €
135
2 667 €
2022 Q4
67
3 611 €
131
2 610 €
2022 Q3
88
3 713 €
194
2 678 €
2022 Q2
80
3 580 €
133
2 600 €
2022 Q1
77
3 533 €
133
2 750 €
2021 Q4
82
3 696 €
137
2 500 €
2021 Q3
117
3 588 €
153
2 673 €
2021 Q2
92
3 448 €
155
2 492 €
2021 Q1
63
3 372 €
120
2 464 €
2020 Q4
88
3 241 €
137
2 393 €
2020 Q3
79
3 255 €
137
2 394 €
2020 Q2
56
3 194 €
125
2 244 €
2020 Q1
74
3 180 €
115
2 154 €
2019 Q4
81
3 065 €
135
2 156 €
2019 Q3
85
3 138 €
155
1 961 €
2019 Q2
76
2 872 €
164
2 054 €
2019 Q1
78
2 934 €
137
1 881 €
2018 Q4
83
2 802 €
122
1 747 €
2018 Q3
104
2 940 €
134
1 786 €
2018 Q2
74
2 813 €
141
1 751 €
2018 Q1
77
2 704 €
118
1 833 €
2017 Q4
84
2 772 €
108
1 898 €
2017 Q3
89
2 780 €
123
1 867 €
2017 Q2
85
2 630 €
125
1 797 €
2017 Q1
84
2 560 €
100
1 790 €
2016 Q4
58
2 500 €
95
1 671 €
2016 Q3
91
2 602 €
77
1 688 €
2016 Q2
72
2 485 €
107
1 817 €
2016 Q1
64
2 442 €
71
1 667 €
2015 Q4
62
2 552 €
97
1 641 €
2015 Q3
74
2 502 €
85
1 922 €
2015 Q2
43
2 421 €
104
1 645 €
2015 Q1
43
2 476 €
54
1 612 €
2014 Q4
68
2 392 €
88
1 878 €
2014 Q3
76
2 480 €
78
2 068 €
2014 Q2
65
2 615 €
74
1 766 €
2014 Q1
42
2 526 €
66
1 690 €

Overview of the latest real estate transactions

The following list is an anonymized overview of the latest transactions. For more details and to find all transactions, please use the map to view transactions by plot or the transaction search page for a search by criteria.

2025-06-25
430 000 €
3 805 € /m²(113 m²)
Sale
Houses
House
5 rooms
113 m2
1 outbuilding
Land
462 m2
-Sols
2025-06-12
4 300 000 €
827 € /m²(5198 m²)
Sale
Commercial property
5198 m2
Land
4992 m2
-Sols
2025-06-11
1 500 €
Sale
Land
3884 m2
-Sols
Land
1482 m2
-Sols
2025-06-10
110 000 €
1 549 € /m²(71 m²)
Sale
Apartments
Apartment
3 rooms
71 m2
2 outbuildings
2025-06-06
280 000 €
2 059 € /m²(136 m²)
Sale
Houses
House
6 rooms
136 m2
Land
422 m2
-Sols
2025-06-04
175 000 €
2 333 € /m²(75 m²)
Sale
Apartments
Apartment
4 rooms
75 m2
3 outbuildings
2025-06-04
261 600 €
2 468 € /m²(106 m²)
Sale
Apartments
Apartment
4 rooms
106 m2
3 outbuildings
2025-06-03
226 701 €
3 598 € /m²(63 m²)
Sale
Apartments
Apartment
3 rooms
63 m2
2 outbuildings
2025-06-03
390 000 €
2 690 € /m²(145 m²)
Sale
Houses
House
6 rooms
145 m2
1 outbuilding
Land
494 m2
-Sols
2025-06-03
40 000 €
3 333 € /m²(12 m²)
Sale
Apartments
Apartment
1 room
12 m2
2025-06-02
160 363 €
1 865 € /m²(86 m²)
Sale
Apartments
Apartment
4 rooms
86 m2
2 outbuildings
2025-06-02
316 500 €
4 058 € /m²(78 m²)
Sale
Apartments
Apartment
4 rooms
78 m2
2 outbuildings
2025-05-28
95 343 €
2 270 € /m²(42 m²)
Sale
Commercial property
42 m2
2025-05-28
300 000 €
3 333 € /m²(90 m²)
Sale
Houses
House
4 rooms
90 m2
Land
579 m2
-Sols
2025-05-28
400 000 €
1 818 € /m²(220 m²)
Sale
Commercial property
220 m2
2025-05-27
183 000 €
3 894 € /m²(47 m²)
Sale
Apartments
Apartment
2 rooms
47 m2
1 outbuilding
2025-05-27
143 000 €
3 488 € /m²(41 m²)
Sale
Apartments
Apartment
2 rooms
41 m2
1 outbuilding
2025-05-26
69 459 €
3 473 € /m²(20 m²)
Sale
Commercial property
20 m2
2025-05-26
216 500 €
2 123 € /m²(102 m²)
Sale
Apartments
Apartment
4 rooms
102 m2
1 outbuilding
2025-05-26
14 000 €
Sale
1 outbuilding

Loire-Atlantique (44)

Most expensive cities

City
name
Descending orderHouses
house
Price per m²
6 276 €
5 313 €
4 971 €
4 956 €
4 688 €
4 625 €
4 293 €
4 255 €
4 213 €
4 196 €
City
name
Descending orderApartments
apt.
Price per m²
6 500 €
6 488 €
5 441 €
5 234 €
5 158 €
5 066 €
5 056 €
5 021 €
4 590 €
4 259 €

Least expensive cities

City
name
Ascending orderHouses
house
Price per m²
816 €
1 058 €
1 071 €
1 087 €
1 164 €
1 174 €
1 178 €
1 178 €
1 275 €
City
name
Ascending orderApartments
apt.
Price per m²
34 €
146 €
278 €
388 €
483 €
564 €
714 €
727 €