emooki
HomePrice mapTransactions
🇬🇧 English🇫🇷 Français🇩🇪 Deutsch🇪🇸 Español🇮🇹 Italiano

Real estate price map


Real estate price map in the municipality of Plessé.

Loire-Atlantique (44)
Plessé

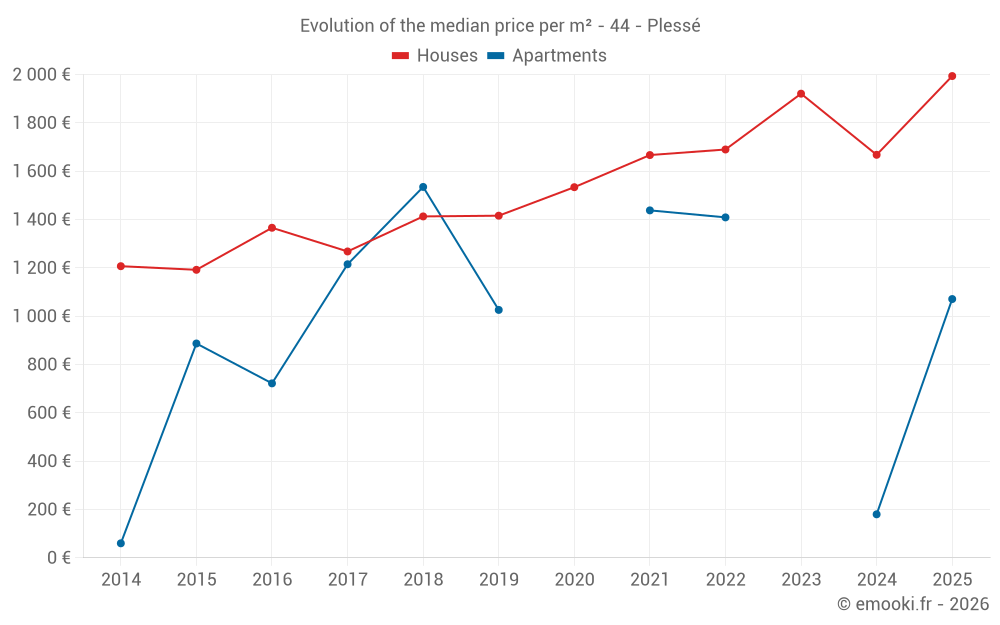
Median price of real estate
in the municipality of Plessé

HousesHouses
1 994  /m²
1-23-45-67-89-10
Reliability 9/10
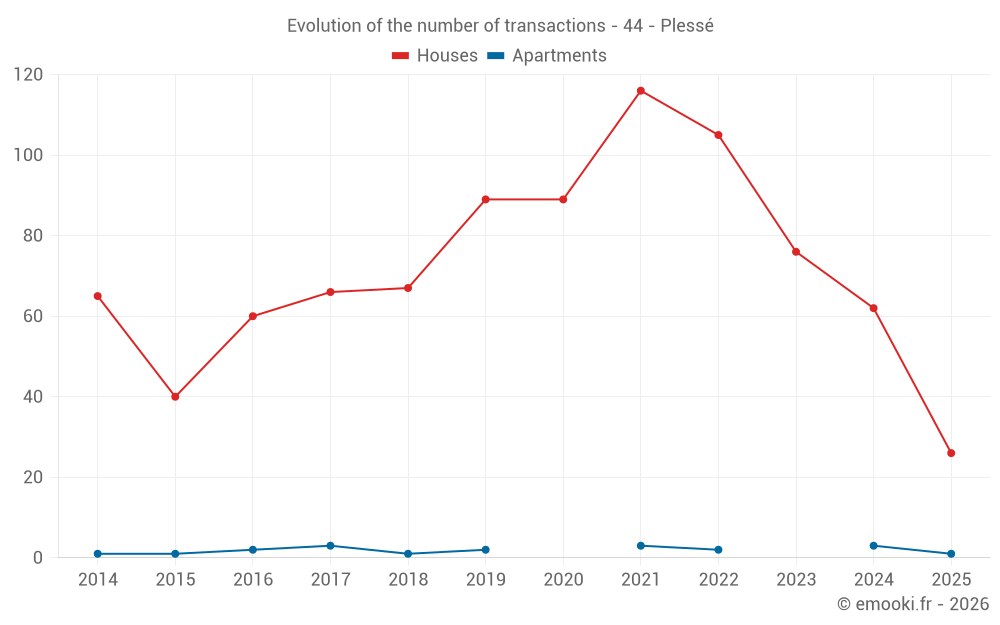
Median price on the 26 transactions of the last 6 months.
from 1 360 to
2 590  /m²
60% of transactions from the 2nd to the 8th deciles.
ApartmentsApartments
1 218  /m²
1-23-45-67-89-10
Reliability 4/10
Median price on the 9 transactions of the last 60 months.
DwellingsDwellings
1 914  /m²
1-23-45-67-89-10
Reliability 9/10
Median price on the 27 transactions of the last 6 months.
from 1 344 to
2 586  /m²
60% of transactions from the 2nd to the 8th deciles.
HousesEvolution of the price per m² of houses since...
1 year
+20%
2 years
+3.8%
3 years
+18%
4 years
+20%
5 years
+30%
6 years
+41%
7 years
+41%
8 years
+57%
9 years
+46%
10 years
+67%
11 years
+65%
ApartmentsEvolution of the price per m² of apartments since...
1 year
--
2 years
--
3 years
--
4 years
--
5 years
--
6 years
--
7 years
--
8 years
--
9 years
--
10 years
--
11 years
--

Yearly evolution

Evolution of the median price per m²

Evolution of the number of transactions

Warning, last year incomplete. Projections made based on the proportions between semesters of the previous year at the departmental/national level and by type of property.

Yearly data

Descending order
Year
Houses
house
transactions
Houses
house
Price per m²
Apartments
apt.
transactions
Apartments
apt.
Price per m²
2025
26
1 994 
1
1 071 
2024
62
1 668 
3
180 
2023
76
1 921 
0
--- 
2022
105
1 690 
2
1 409 
2021
116
1 667 
3
1 438 
2020
89
1 534 
0
--- 
2019
89
1 416 
2
1 026 
2018
67
1 413 
1
1 535 
2017
66
1 268 
3
1 215 
2016
60
1 366 
2
722 
2015
40
1 192 
1
887 
2014
65
1 207 
1
60 

Analysis

Structure of prices per m²

Values of price percentiles per m² over the periods used for the estimated price of each type of property.

Structure of transaction amounts

Values of transaction amounts percentiles over the periods used for the estimated price of each type of property.

Transaction amounts and prices per m² by percentile

Ascending order
Percentile
Houses
house
Price per m²
Houses
house
Transaction amount
Apartments
apt.
Price per m²
Apartments
apt.
Transaction amount
10th percentile
1 056 
81 500 
156 
26 000 
20th percentile
1 360 
130 K
695 
81 000 
30th percentile
1 528 
152 K
1 052 
117 K
40th percentile
1 765 
175 K
1 100 
135 K
50th percentile
1 994 
184 K
1 218 
193 K
60th percentile
2 232 
200 K
1 331 
208 K
70th percentile
2 466 
209 K
1 406 
229 K
80th percentile
2 590 
215 K
1 503 
284 K
90th percentile
3 062 
276 K
1 916 
352 K

National and departmental comparison

Evolution of the median price per m² of houses

Evolution of the median price per m² of apartments

Quarterly evolution

Evolution of the median price per m²

Evolution of the number of transactions

Quarterly data

Descending order
Quarter
Houses
house
transactions
Houses
house
Price per m²
Apartments
apt.
transactions
Apartments
apt.
Price per m²
2025 Q2
12
1 919 
1
1 071 
2025 Q1
14
2 100 
0
--- 
2024 Q4
21
1 488 
2
120 
2024 Q3
18
1 902 
0
--- 
2024 Q2
13
1 740 
1
1 359 
2024 Q1
10
1 592 
0
--- 
2023 Q4
14
1 984 
0
--- 
2023 Q3
20
1 692 
0
--- 
2023 Q2
18
1 986 
0
--- 
2023 Q1
24
1 789 
0
--- 
2022 Q4
24
1 486 
0
--- 
2022 Q3
30
2 056 
2
1 409 
2022 Q2
26
1 478 
0
--- 
2022 Q1
25
1 667 
0
--- 
2021 Q4
28
1 780 
1
3 182 
2021 Q3
37
1 715 
0
--- 
2021 Q2
29
1 643 
0
--- 
2021 Q1
22
1 474 
2
1 238 
2020 Q4
33
1 538 
0
--- 
2020 Q3
22
1 564 
0
--- 
2020 Q2
19
1 500 
0
--- 
2020 Q1
15
1 573 
0
--- 
2019 Q4
27
1 353 
2
1 026 
2019 Q3
22
1 456 
0
--- 
2019 Q2
24
1 390 
0
--- 
2019 Q1
16
1 567 
0
--- 
2018 Q4
15
1 351 
0
--- 
2018 Q3
26
1 461 
1
1 535 
2018 Q2
10
1 356 
0
--- 
2018 Q1
16
1 451 
0
--- 
2017 Q4
16
1 210 
1
1 215 
2017 Q3
19
1 117 
1
1 348 
2017 Q2
18
1 342 
0
--- 
2017 Q1
13
1 096 
1
965 
2016 Q4
16
1 492 
0
--- 
2016 Q3
20
1 392 
0
--- 
2016 Q2
12
924 
1
674 
2016 Q1
12
1 332 
1
769 
2015 Q4
13
1 287 
1
887 
2015 Q3
10
1 172 
0
--- 
2015 Q2
10
1 004 
0
--- 
2015 Q1
7
1 276 
0
--- 
2014 Q4
16
1 225 
0
--- 
2014 Q3
17
1 217 
1
60 
2014 Q2
21
1 438 
0
--- 
2014 Q1
11
966 
0
--- 

Loire-Atlantique (44)

Most expensive cities

City
name
Descending orderHouses
house
Price per m²
5 313 
4 971 
4 956 
4 688 
4 625 
4 293 
4 255 
4 196 
City
name
Descending orderApartments
apt.
Price per m²
6 488 
5 441 
5 234 
5 158 
5 066 
4 590 

Least expensive cities

City
name
Ascending orderHouses
house
Price per m²
1 058 
1 071 
1 087 
1 178 
1 178 
1 275 
City
name
Ascending orderApartments
apt.
Price per m²
34 
146 
278 
483 
714 
727