emooki
HomePrice mapTransactions
🇬🇧 English🇫🇷 Français🇩🇪 Deutsch🇪🇸 Español🇮🇹 Italiano

Real estate price map


Real estate price map in the municipality of Guémené-Penfao.

Loire-Atlantique (44)
Guémené-Penfao

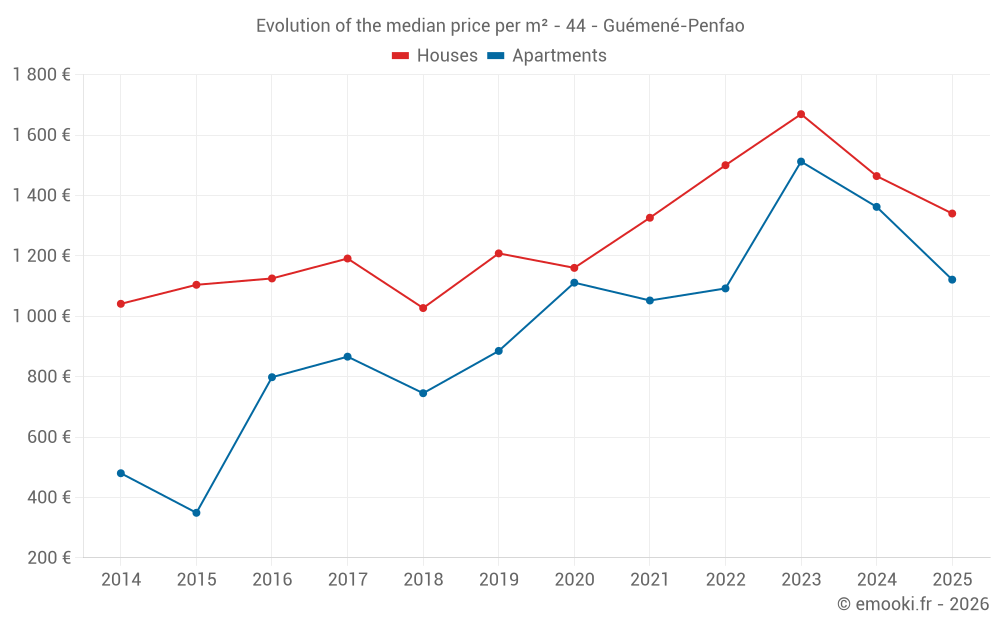
Median price of real estate
in the municipality of Guémené-Penfao

HousesHouses
1 340  /m²
1-23-45-67-89-10
Reliability 9/10
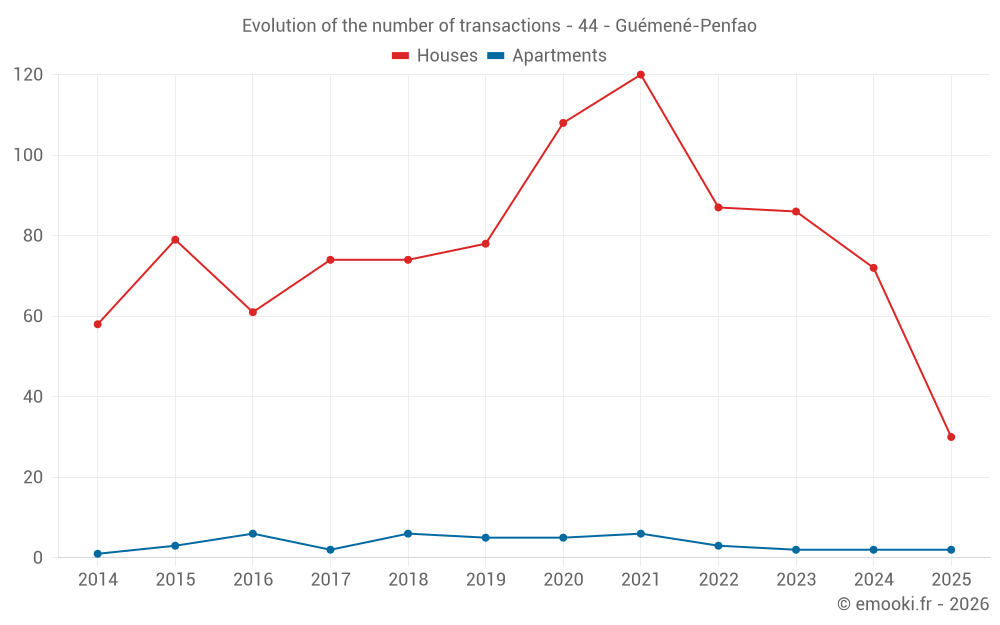
Median price on the 30 transactions of the last 6 months.
from 769 to
2 002  /m²
60% of transactions from the 2nd to the 8th deciles.
ApartmentsApartments
1 121  /m²
1-23-45-67-89-10
Reliability 5/10
Median price on the 12 transactions of the last 48 months.
from 862 to
1 596  /m²
60% of transactions from the 2nd to the 8th deciles.
DwellingsDwellings
1 298  /m²
1-23-45-67-89-10
Reliability 9/10
Median price on the 32 transactions of the last 6 months.
from 802 to
2 000  /m²
60% of transactions from the 2nd to the 8th deciles.
HousesEvolution of the price per m² of houses since...
1 year
-8.5%
2 years
-20%
3 years
-11%
4 years
+1.1%
5 years
+16%
6 years
+11%
7 years
+30%
8 years
+13%
9 years
+19%
10 years
+21%
11 years
+29%
ApartmentsEvolution of the price per m² of apartments since...
1 year
--
2 years
--
3 years
--
4 years
--
5 years
--
6 years
--
7 years
--
8 years
--
9 years
--
10 years
--
11 years
--

Yearly evolution

Evolution of the median price per m²

Evolution of the number of transactions

Warning, last year incomplete. Projections made based on the proportions between semesters of the previous year at the departmental/national level and by type of property.

Yearly data

Descending order
Year
Houses
house
transactions
Houses
house
Price per m²
Apartments
apt.
transactions
Apartments
apt.
Price per m²
2025
30
1 340 
2
1 121 
2024
72
1 464 
2
1 362 
2023
86
1 669 
2
1 512 
2022
87
1 500 
3
1 092 
2021
120
1 326 
6
1 052 
2020
108
1 160 
5
1 111 
2019
78
1 208 
5
885 
2018
74
1 027 
6
745 
2017
74
1 191 
2
866 
2016
61
1 125 
6
798 
2015
79
1 104 
3
349 
2014
58
1 041 
1
480 

Analysis

Structure of prices per m²

Values of price percentiles per m² over the periods used for the estimated price of each type of property.

Structure of transaction amounts

Values of transaction amounts percentiles over the periods used for the estimated price of each type of property.

Transaction amounts and prices per m² by percentile

Ascending order
Percentile
Houses
house
Price per m²
Houses
house
Transaction amount
Apartments
apt.
Price per m²
Apartments
apt.
Transaction amount
10th percentile
485 
34 500 
793 
106 K
20th percentile
769 
44 300 
862 
118 K
30th percentile
1 085 
75 800 
998 
134 K
40th percentile
1 218 
100 K
1 094 
142 K
50th percentile
1 340 
119 K
1 121 
147 K
60th percentile
1 549 
133 K
1 303 
149 K
70th percentile
1 825 
150 K
1 479 
151 K
80th percentile
2 002 
169 K
1 596 
206 K
90th percentile
2 209 
194 K
1 750 
240 K

National and departmental comparison

Evolution of the median price per m² of houses

Evolution of the median price per m² of apartments

Quarterly evolution

Evolution of the median price per m²

Evolution of the number of transactions

Quarterly data

Descending order
Quarter
Houses
house
transactions
Houses
house
Price per m²
Apartments
apt.
transactions
Apartments
apt.
Price per m²
2025 Q2
10
1 430 
1
1 096 
2025 Q1
20
1 298 
1
1 146 
2024 Q4
20
1 512 
2
1 362 
2024 Q3
20
1 444 
0
--- 
2024 Q2
14
1 418 
0
--- 
2024 Q1
18
1 252 
0
--- 
2023 Q4
14
1 282 
0
--- 
2023 Q3
24
1 598 
1
1 407 
2023 Q2
23
1 628 
0
--- 
2023 Q1
25
1 880 
1
1 617 
2022 Q4
19
1 721 
1
1 981 
2022 Q3
23
1 385 
1
788 
2022 Q2
17
1 435 
0
--- 
2022 Q1
28
1 417 
1
1 092 
2021 Q4
33
1 457 
3
838 
2021 Q3
44
1 392 
0
--- 
2021 Q2
25
1 176 
1
1 265 
2021 Q1
18
1 361 
2
1 076 
2020 Q4
37
1 198 
3
1 097 
2020 Q3
25
1 172 
0
--- 
2020 Q2
18
1 146 
0
--- 
2020 Q1
28
1 125 
2
1 468 
2019 Q4
18
1 320 
1
787 
2019 Q3
21
1 013 
3
885 
2019 Q2
16
1 226 
0
--- 
2019 Q1
23
1 208 
1
1 194 
2018 Q4
21
1 034 
1
909 
2018 Q3
27
1 063 
2
700 
2018 Q2
11
897 
0
--- 
2018 Q1
15
1 020 
3
581 
2017 Q4
20
1 222 
0
--- 
2017 Q3
17
1 163 
0
--- 
2017 Q2
24
1 196 
1
957 
2017 Q1
13
1 235 
1
775 
2016 Q4
16
1 308 
3
787 
2016 Q3
17
1 048 
1
1 529 
2016 Q2
17
991 
1
808 
2016 Q1
11
1 125 
1
542 
2015 Q4
22
1 472 
0
--- 
2015 Q3
26
1 111 
1
349 
2015 Q2
19
857 
1
353 
2015 Q1
12
1 042 
1
271 
2014 Q4
21
1 111 
0
--- 
2014 Q3
15
1 196 
1
480 
2014 Q2
11
1 000 
0
--- 
2014 Q1
11
958 
0
--- 

Loire-Atlantique (44)

Most expensive cities

City
name
Descending orderHouses
house
Price per m²
5 313 
4 971 
4 956 
4 688 
4 625 
4 293 
4 255 
4 196 
City
name
Descending orderApartments
apt.
Price per m²
6 488 
5 441 
5 234 
5 158 
5 066 
4 590 

Least expensive cities

City
name
Ascending orderHouses
house
Price per m²
1 058 
1 071 
1 087 
1 178 
1 178 
1 275 
City
name
Ascending orderApartments
apt.
Price per m²
34 
146 
278 
483 
714 
727