emooki
HomePrice mapTransactions
🇬🇧 English🇫🇷 Français🇩🇪 Deutsch🇪🇸 Español🇮🇹 Italiano

Real estate price map


Real estate price map in the municipality of Clisson, choose a section to see transactions by parcel.

Loire-Atlantique (44)

Clisson - Real estate price m²

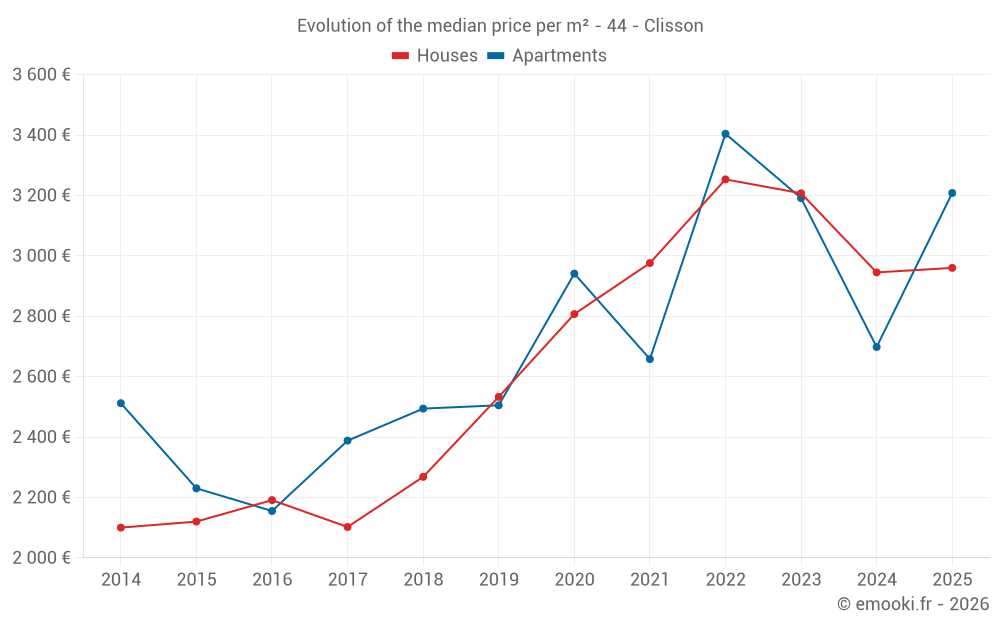
Median price of real estate
in the municipality of Clisson

HousesHouses
2 960  /m²
1-23-45-67-89-10
Reliability 9/10
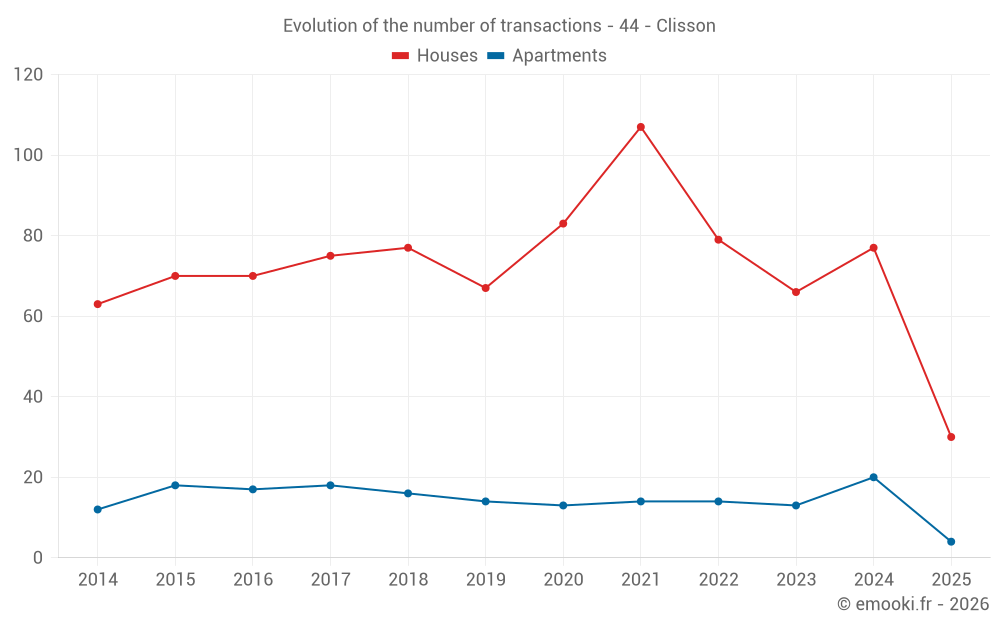
Median price on the 30 transactions of the last 6 months.
from 2 364 to
3 277  /m²
60% of transactions from the 2nd to the 8th deciles.
ApartmentsApartments
2 933  /m²
1-23-45-67-89-10
Reliability 7/10
Median price on the 31 transactions of the last 24 months.
from 2 525 to
3 414  /m²
60% of transactions from the 2nd to the 8th deciles.
DwellingsDwellings
2 981  /m²
1-23-45-67-89-10
Reliability 9/10
Median price on the 34 transactions of the last 6 months.
from 2 417 to
3 359  /m²
60% of transactions from the 2nd to the 8th deciles.
HousesEvolution of the price per m² of houses since...
1 year
+0.5%
2 years
-7.7%
3 years
-9%
4 years
-0.5%
5 years
+5.5%
6 years
+17%
7 years
+31%
8 years
+41%
9 years
+35%
10 years
+40%
11 years
+41%
The price per m² of houses has decreased by 9% since 3 years, but it has increased by 41% in 11 years.
ApartmentsEvolution of the price per m² of apartments since...
1 year
+19%
2 years
+0.5%
3 years
-5.8%
4 years
+21%
5 years
+9.1%
6 years
+28%
7 years
+29%
8 years
+34%
9 years
+49%
10 years
+44%
11 years
+28%
The price per m² of apartments has decreased by 5.8% since 3 years, but it has increased by 49% in 9 years.

Yearly evolution

Evolution of the median price per m²

Evolution of the median price per m² - 44 - Clisson

Evolution of the number of transactions

Warning, last year incomplete. Projections made based on the proportions between semesters of the previous year at the departmental/national level and by type of property.

Evolution of the number of transactions - 44 - Clisson

Yearly data

Descending order
Year
Houses
house
transactions
Houses
house
Price per m²
Apartments
apt.
transactions
Apartments
apt.
Price per m²
2025
30
2 960 
4
3 208 
2024
77
2 945 
20
2 698 
2023
66
3 207 
13
3 191 
2022
79
3 253 
14
3 404 
2021
107
2 976 
14
2 658 
2020
83
2 807 
13
2 941 
2019
67
2 533 
14
2 505 
2018
77
2 268 
16
2 494 
2017
75
2 102 
18
2 388 
2016
70
2 191 
17
2 155 
2015
70
2 120 
18
2 230 
2014
63
2 100 
12
2 512 

Analysis

Structure of prices per m²

Values of price percentiles per m² over the periods used for the estimated price of each type of property.

Structure of transaction amounts

Values of transaction amounts percentiles over the periods used for the estimated price of each type of property.

Transaction amounts and prices per m² by percentile

Ascending order
Percentile
Houses
house
Price per m²
Houses
house
Transaction amount
Apartments
apt.
Price per m²
Apartments
apt.
Transaction amount
10th percentile
2 134 
173 K
2 381 
100 K
20th percentile
2 364 
194 K
2 525 
125 K
30th percentile
2 491 
215 K
2 625 
135 K
40th percentile
2 850 
230 K
2 727 
145 K
50th percentile
2 960 
239 K
2 933 
150 K
60th percentile
3 146 
279 K
3 050 
184 K
70th percentile
3 193 
291 K
3 280 
197 K
80th percentile
3 277 
365 K
3 414 
205 K
90th percentile
3 600 
419 K
3 610 
252 K

National and departmental comparison

Evolution of the median price per m² of houses

Evolution of the median price per m² of apartments

Quarterly evolution

Evolution of the median price per m²

Evolution of the number of transactions

Quarterly data

Descending order
Quarter
Houses
house
transactions
Houses
house
Price per m²
Apartments
apt.
transactions
Apartments
apt.
Price per m²
2025 Q2
9
2 927 
2
3 452 
2025 Q1
21
2 962 
2
2 838 
2024 Q4
24
3 196 
4
2 626 
2024 Q3
21
3 000 
3
3 683 
2024 Q2
19
2 556 
11
2 670 
2024 Q1
13
3 010 
2
2 673 
2023 Q4
17
3 077 
5
3 125 
2023 Q3
21
3 188 
2
2 974 
2023 Q2
12
3 487 
4
3 594 
2023 Q1
16
3 534 
2
2 371 
2022 Q4
23
3 452 
0
--- 
2022 Q3
24
3 282 
4
3 185 
2022 Q2
16
3 462 
4
3 405 
2022 Q1
16
2 793 
6
3 262 
2021 Q4
23
3 369 
6
2 569 
2021 Q3
29
3 217 
3
3 245 
2021 Q2
32
2 780 
2
2 945 
2021 Q1
23
2 710 
3
2 738 
2020 Q4
19
2 841 
5
3 387 
2020 Q3
24
2 810 
1
3 108 
2020 Q2
19
2 885 
3
2 763 
2020 Q1
21
2 622 
4
2 936 
2019 Q4
21
2 632 
6
2 412 
2019 Q3
16
2 628 
5
2 241 
2019 Q2
13
2 432 
1
2 798 
2019 Q1
17
2 500 
2
2 799 
2018 Q4
18
2 416 
6
2 414 
2018 Q3
22
2 046 
4
3 238 
2018 Q2
24
2 412 
2
1 918 
2018 Q1
13
2 112 
4
2 482 
2017 Q4
25
2 188 
0
--- 
2017 Q3
18
2 120 
4
2 432 
2017 Q2
22
2 206 
8
2 435 
2017 Q1
10
1 776 
6
2 331 
2016 Q4
18
2 177 
8
2 306 
2016 Q3
17
2 338 
2
2 547 
2016 Q2
19
1 888 
2
1 895 
2016 Q1
16
2 176 
5
2 155 
2015 Q4
16
2 102 
6
2 576 
2015 Q3
23
2 105 
2
2 556 
2015 Q2
20
2 154 
7
1 951 
2015 Q1
11
2 100 
3
1 986 
2014 Q4
23
1 982 
2
2 304 
2014 Q3
16
2 092 
4
2 656 
2014 Q2
16
1 992 
4
1 823 
2014 Q1
8
2 340 
2
2 617 

Overview of the latest real estate transactions

The following list is an anonymized overview of the latest transactions. For more details and to find all transactions, please use the map to view transactions by plot or the transaction search page for a search by criteria.

2025-06-12
189 000 
2 363  /m²(80 m²)
Sale
Houses
House
1 room
80 m2
Land
117 m2
-Sols
Land
41 m2
-Terrains à bâtir
Land
156 m2
-Jardins
Land
507 m2
-Terrains à bâtir
2025-06-04
138 000 
3 366  /m²(41 m²)
Sale
Apartments
Apartment
2 rooms
41 m2
1 outbuilding
2025-05-19
1 000 
Sale
Land
5 m2
-Sols
2025-05-15
175 355 
3 507  /m²(50 m²)
Sale
Houses
House
2 rooms
50 m2
Land
173 m2
-Sols
2025-05-14
360 000 
3 913  /m²(92 m²)
Sale
Houses
House
5 rooms
92 m2
Land
27 m2
-Sols
Land
34 m2
-Sols
2025-05-07
415 000 
1 095  /m²(379 m²)
Sale
Houses
House
3 rooms
78 m2
Houses
House
3 rooms
67 m2
Houses
House
4 rooms
88 m2
Houses
House
3 rooms
78 m2
Houses
House
3 rooms
68 m2
Land
630 m2
-Terrains d'agrément
Land
1000 m2
-Sols
2025-05-07
90 000 
Sale
Land
490 m2
-Terrains à bâtir
2025-05-06
238 000 
5 289  /m²(45 m²)
Sale
Houses
House
3 rooms
45 m2
Land
598 m2
-Sols
2025-05-05
53 034 
Sale
Land
3574 m2
-Eaux
/Mare
Land
3574 m2
-Terrains d'agrément
2025-04-30
215 000 
2 471  /m²(87 m²)
Sale
Houses
House
4 rooms
87 m2
Land
840 m2
-Sols
2025-04-29
342 500 
3 171  /m²(108 m²)
Sale
Houses
House
4 rooms
108 m2
1 outbuilding
Land
487 m2
-Sols
2025-04-28
260 000 
Sale
Land
909 m2
-Prés
Land
909 m2
-Prés
2025-04-22
220 000 
2 095  /m²(105 m²)
3 143  /m²(70 m²)
Sale
Apartments
Apartment
2 rooms
34 m2
Apartments
Apartment
1 room
36 m2
Commercial property
35 m2
1 outbuilding
Land
50 m2
-Sols
2025-04-16
20 000 
435  /m²(46 m²)
Sale
Houses
House
1 room
46 m2
1 outbuilding
Land
218 m2
-Sols
2025-04-16
185 000 
Sale
Land
714 m2
-Sols
2025-04-14
170 000 
Sale
Land
8 m2
-Sols
Land
2 m2
-Sols
Land
492 m2
-Jardins
2025-04-10
6 500 
Sale
Land
1297 m2
-Prés
Land
45 m2
-Sols
2025-04-10
290 000 
3 537  /m²(82 m²)
Sale
Apartments
Apartment
4 rooms
82 m2
2 outbuildings
2025-04-10
840 
Sale
Land
56 m2
-Sols
2025-04-08
240 000 
2 927  /m²(82 m²)
Sale
Houses
House
5 rooms
82 m2
1 outbuilding
Land
654 m2
-Sols
Land
8 m2
-Sols
2044 transactions listed in the municipality

Loire-Atlantique (44)

Most expensive cities

City
name
Descending orderHouses
house
Price per m²
5 313 
4 971 
4 956 
4 688 
4 625 
4 293 
4 255 
4 196 
City
name
Descending orderApartments
apt.
Price per m²
6 488 
5 441 
5 234 
5 158 
5 066 
4 590 

Least expensive cities

City
name
Ascending orderHouses
house
Price per m²
1 058 
1 071 
1 087 
1 178 
1 178 
1 275 
City
name
Ascending orderApartments
apt.
Price per m²
34 
146 
278 
483 
714 
727