Median price of real estate
in the municipality of Le Pallet
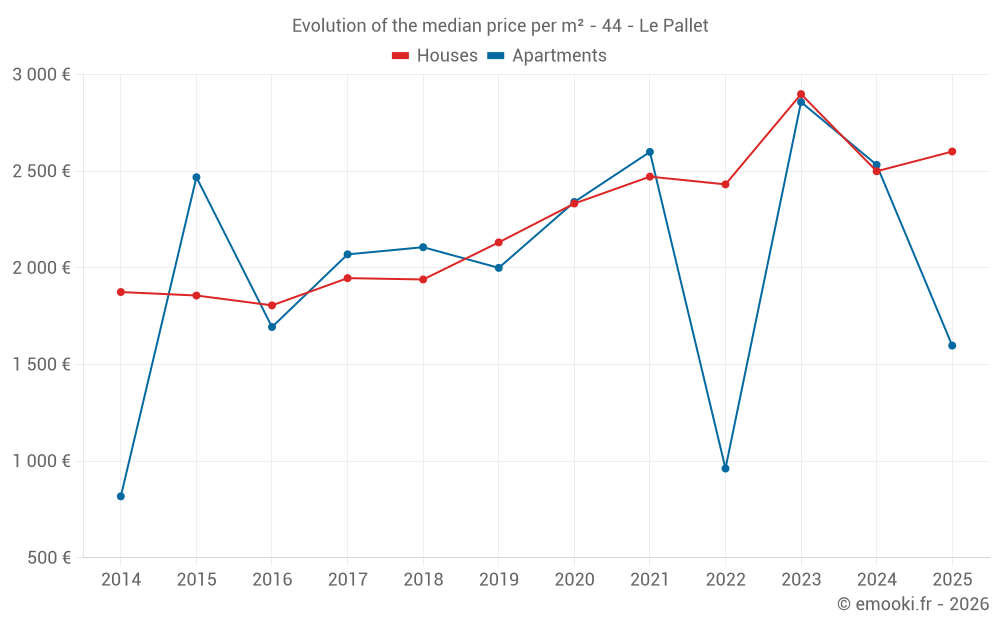
Houses
2 500 € /m²
Reliability 8/10
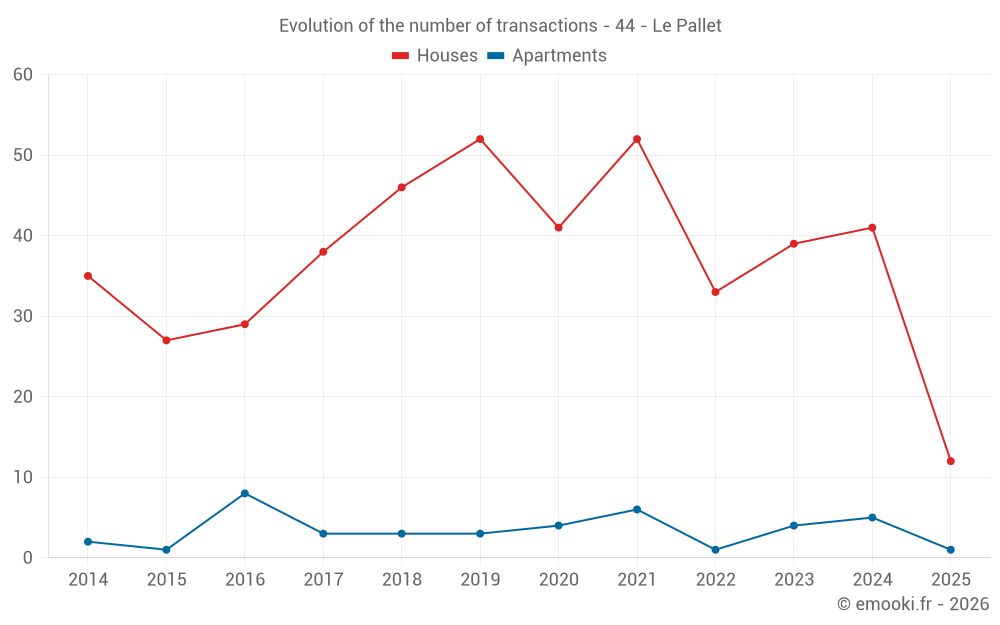
Median price on the 37 transactions of the last 12 months.
from 1 843 to
2 984 € /m²
2 984 € /m²
60% of transactions from the 2nd to the 8th deciles.
Apartments
2 533 € /m²
Reliability 5/10
Median price on the 13 transactions of the last 48 months.
from 2 175 to
2 691 € /m²
2 691 € /m²
60% of transactions from the 2nd to the 8th deciles.
Dwellings
2 488 € /m²
Reliability 8/10
Median price on the 40 transactions of the last 12 months.
from 1 819 to
2 931 € /m²
2 931 € /m²
60% of transactions from the 2nd to the 8th deciles.