emooki
HomePrice mapTransactions
🇬🇧 English🇫🇷 Français🇩🇪 Deutsch🇪🇸 Español🇮🇹 Italiano

Real estate price map


Real estate price map in the municipality of Champagnier, choose a section to see transactions by parcel.

Isère (38)

Champagnier - Real estate price m²

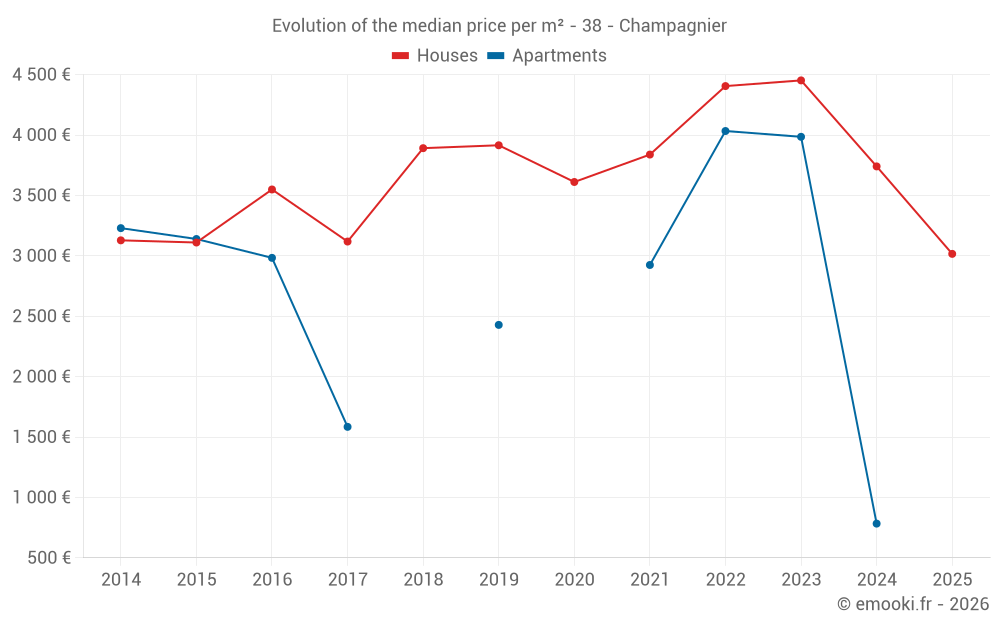
Median price of real estate
in the municipality of Champagnier

HousesHouses
3 780  /m²
1-23-45-67-89-10
Reliability 7/10
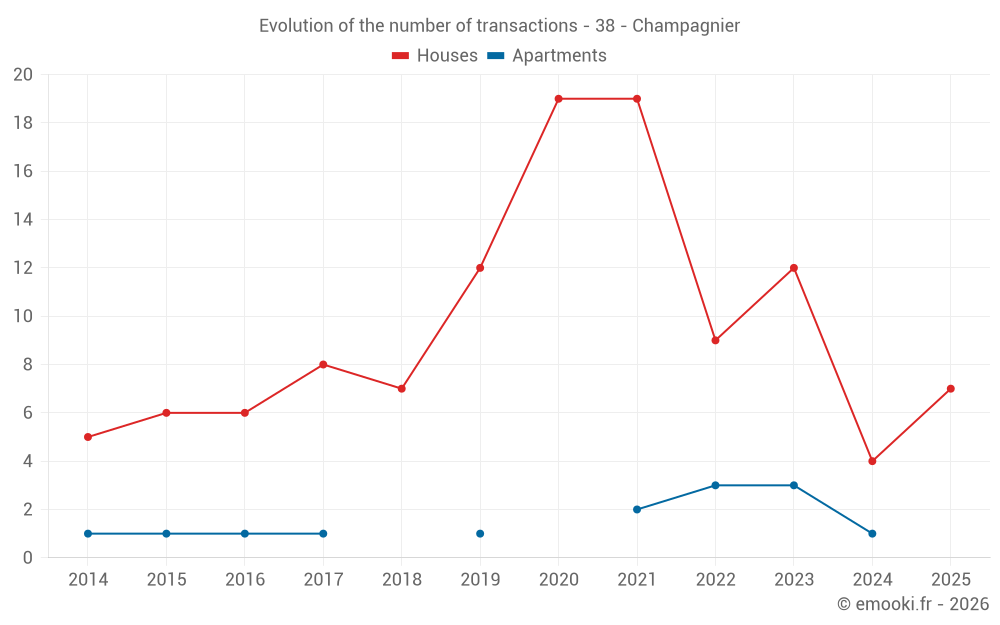
Median price on the 18 transactions of the last 24 months.
from 2 865 to
4 820  /m²
60% of transactions from the 2nd to the 8th deciles.
ApartmentsApartments
3 515  /m²
1-23-45-67-89-10
Reliability 4/10
Median price on the 9 transactions of the last 60 months.
DwellingsDwellings
3 780  /m²
1-23-45-67-89-10
Reliability 7/10
Median price on the 20 transactions of the last 24 months.
from 2 732 to
4 659  /m²
60% of transactions from the 2nd to the 8th deciles.
HousesEvolution of the price per m² of houses since...
1 year
-19%
2 years
-32%
3 years
-32%
4 years
-21%
5 years
-16%
6 years
-23%
7 years
-22%
8 years
-3.3%
9 years
-15%
10 years
-3%
11 years
-3.6%

Yearly evolution

Evolution of the median price per m²

Evolution of the median price per m² - 38 - Champagnier

Evolution of the number of transactions

Warning, last year incomplete. Projections made based on the proportions between semesters of the previous year at the departmental/national level and by type of property.

Evolution of the number of transactions - 38 - Champagnier

Yearly data

Descending order
Year
Houses
house
transactions
Houses
house
Price per m²
Apartments
apt.
transactions
Apartments
apt.
Price per m²
2025
7
3 016 
0
--- 
2024
4
3 740 
1
783 
2023
12
4 452 
3
3 985 
2022
9
4 405 
3
4 033 
2021
19
3 838 
2
2 924 
2020
19
3 611 
0
--- 
2019
12
3 915 
1
2 428 
2018
7
3 891 
0
--- 
2017
8
3 118 
1
1 584 
2016
6
3 549 
1
2 983 
2015
6
3 110 
1
3 139 
2014
5
3 128 
1
3 229 

Analysis

Structure of prices per m²

Values of price percentiles per m² over the periods used for the estimated price of each type of property.

Structure of transaction amounts

Values of transaction amounts percentiles over the periods used for the estimated price of each type of property.

Transaction amounts and prices per m² by percentile

Ascending order
Percentile
Houses
house
Price per m²
Houses
house
Transaction amount
Apartments
apt.
Price per m²
Apartments
apt.
Transaction amount
10th percentile
2 560 
264 K
2 197 
308 K
20th percentile
2 865 
299 K
2 955 
330 K
30th percentile
3 289 
331 K
3 253 
343 K
40th percentile
3 658 
402 K
3 340 
352 K
50th percentile
3 780 
434 K
3 515 
367 K
60th percentile
3 992 
455 K
3 891 
384 K
70th percentile
4 436 
488 K
4 014 
421 K
80th percentile
4 820 
613 K
4 182 
447 K
90th percentile
5 078 
635 K
4 509 
500 K

National and departmental comparison

Evolution of the median price per m² of houses

Evolution of the median price per m² of apartments

Quarterly evolution

Evolution of the median price per m²

Evolution of the number of transactions

Quarterly data

Descending order
Quarter
Houses
house
transactions
Houses
house
Price per m²
Apartments
apt.
transactions
Apartments
apt.
Price per m²
2025 Q2
3
3 016 
0
--- 
2025 Q1
4
3 293 
0
--- 
2024 Q4
2
3 201 
0
--- 
2024 Q3
1
4 010 
0
--- 
2024 Q2
1
3 842 
1
783 
2023 Q4
2
4 349 
1
3 985 
2023 Q3
5
5 064 
0
--- 
2023 Q2
1
3 799 
1
3 225 
2023 Q1
4
4 286 
1
4 920 
2022 Q4
0
--- 
1
4 406 
2022 Q2
3
5 045 
1
3 515 
2022 Q1
6
3 988 
1
4 033 
2021 Q4
3
4 376 
1
3 296 
2021 Q3
7
4 251 
1
2 551 
2021 Q2
3
3 738 
0
--- 
2021 Q1
6
3 492 
0
--- 
2020 Q4
3
3 444 
0
--- 
2020 Q3
4
3 888 
0
--- 
2020 Q2
5
3 770 
0
--- 
2020 Q1
7
3 636 
0
--- 
2019 Q4
6
3 775 
1
2 428 
2019 Q3
2
4 469 
0
--- 
2019 Q2
4
4 254 
0
--- 
2018 Q4
3
3 779 
0
--- 
2018 Q3
1
4 529 
0
--- 
2018 Q1
3
5 688 
0
--- 
2017 Q4
1
3 409 
0
--- 
2017 Q3
1
3 615 
0
--- 
2017 Q2
3
3 114 
0
--- 
2017 Q1
3
1 960 
1
1 584 
2016 Q4
2
3 743 
0
--- 
2016 Q3
3
2 247 
0
--- 
2016 Q2
1
3 864 
0
--- 
2016 Q1
0
--- 
1
2 983 
2015 Q4
2
2 707 
1
3 139 
2015 Q3
1
1 968 
0
--- 
2015 Q2
1
3 404 
0
--- 
2015 Q1
2
3 297 
0
--- 
2014 Q4
1
3 344 
1
3 229 
2014 Q3
2
2 146 
0
--- 
2014 Q2
1
2 986 
0
--- 
2014 Q1
1
3 195 
0
--- 

Overview of the latest real estate transactions

The following list is an anonymized overview of the latest transactions. For more details and to find all transactions, please use the map to view transactions by plot or the transaction search page for a search by criteria.

2025-06-02
313 650 
3 016  /m²(104 m²)
Sale
Houses
House
3 rooms
104 m2
Land
228 m2
-Sols
2025-05-06
260 000 
3 250  /m²(80 m²)
Sale
Houses
House
4 rooms
80 m2
Land
341 m2
-Sols
2025-04-25
70 000 
1 429  /m²(49 m²)
Sale
Houses
House
2 rooms
49 m2
Land
26 m2
-Sols
2025-04-24
400 
Sale
Land
3 m2
-Sols
2025-03-28
335 000 
3 988  /m²(84 m²)
Sale
Houses
House
4 rooms
84 m2
2025-03-21
480 800 
4 579  /m²(105 m²)
Sale
Houses
House
5 rooms
105 m2
Land
402 m2
-Sols
Land
9 m2
-Sols
Land
127 m2
-Sols
Land
121 m2
-Sols
Land
145 m2
-Sols
Land
60 m2
-Sols
2025-03-18
15 840 
Sale
1 outbuilding
Land
4115 m2
-Terres
2025-03-17
3 176 
Sale
Land
3970 m2
-Terres
2025-02-20
289 262 
2 472  /m²(117 m²)
Sale
Houses
House
5 rooms
117 m2
Land
632 m2
-Sols
Land
458 m2
-Sols
Land
95 m2
-Sols
Land
998 m2
-Sols
2025-01-07
265 000 
2 598  /m²(102 m²)
Sale
Houses
House
4 rooms
102 m2
2 outbuildings
2024-12-23
420 250 
2 765  /m²(152 m²)
Sale
Houses
House
7 rooms
152 m2
Land
588 m2
-Sols
Land
748 m2
-Jardins
/Jardin potager
2024-12-18
331 000 
3 637  /m²(91 m²)
Sale
Houses
House
4 rooms
91 m2
Land
135 m2
-Sols
Land
13 m2
-Terrains à bâtir
Land
13 m2
-Terrains à bâtir
2024-11-21
286 
Sale
Land
135 m2
-Taillis simples
Land
1240 m2
-Taillis simples
Land
4640 m2
-Taillis simples
2024-11-14
1 014 
Sale
Land
284 m2
-Taillis simples
Land
2836 m2
-Terres
2024-11-14
6 500 
Sale
Land
14872 m2
-Terres
2024-10-31
9 000 
Sale
Land
10330 m2
-Landes
/Friche
Land
4234 m2
-Landes
/Friche
Land
6680 m2
-Taillis simples
Land
1700 m2
-Taillis simples
2024-10-07
1 
Sale
Land
293 m2
-Sols
Land
260 m2
-Sols
Land
8 m2
-Sols
Land
311 m2
-Sols
Land
383 m2
-Sols
2024-10-04
526 
Sale
Land
159 m2
-Terres
Land
313 m2
-Sols
Land
54 m2
-Terres
2024-09-10
486 000 
3 219  /m²(151 m²)
Auction
Houses
House
5 rooms
151 m2
1 outbuilding
Land
1002 m2
-Sols
2024-07-26
12 000 
Sale
1 outbuilding
Land
4115 m2
-Terres
283 transactions listed in the municipality

Isère (38)

Most expensive cities

City
name
Descending orderHouses
house
Price per m²
8 262 
4 917 
4 777 
4 663 
4 610 
4 575 
4 506 
City
name
Descending orderApartments
apt.
Price per m²
7 647 
6 370 
5 636 
4 866 
4 524 
4 492 
4 249 
4 234 
3 958 

Least expensive cities

City
name
Ascending orderHouses
house
Price per m²
502 
722 
975 
1 133 
1 198 
1 237 
City
name
Ascending orderApartments
apt.
Price per m²
475 
483 
541 
562