emooki
HomePrice mapTransactions
🇬🇧 English🇫🇷 Français🇩🇪 Deutsch🇪🇸 Español🇮🇹 Italiano

Real estate price map


Real estate price map in the municipality of Claix, choose a section to see transactions by parcel.

Isère (38)
Claix

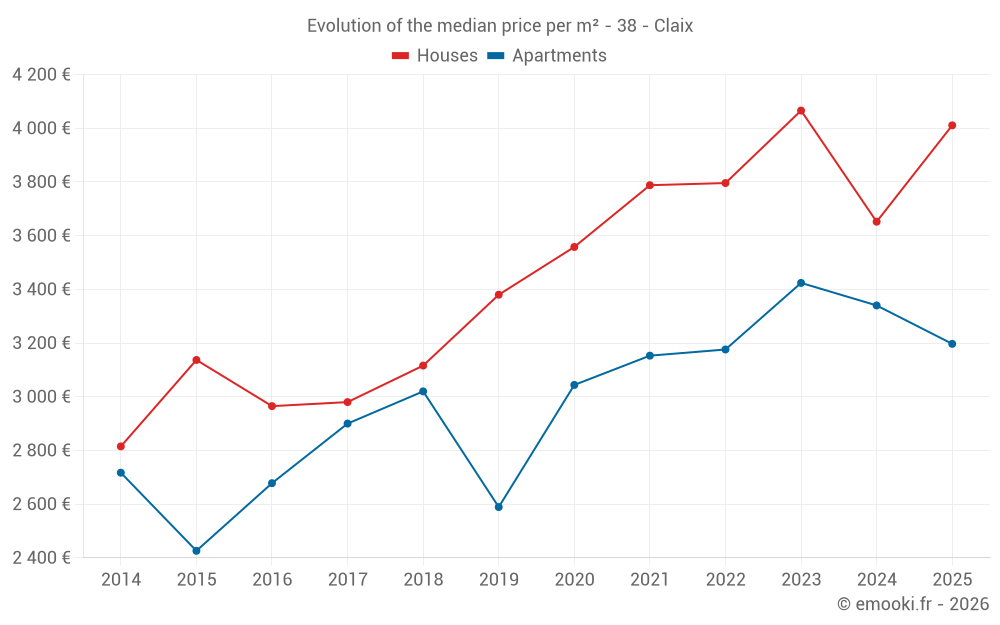
Median price of real estate
in the municipality of Claix

HousesHouses
3 709 € /m²
1-23-45-67-89-10
Reliability 8/10
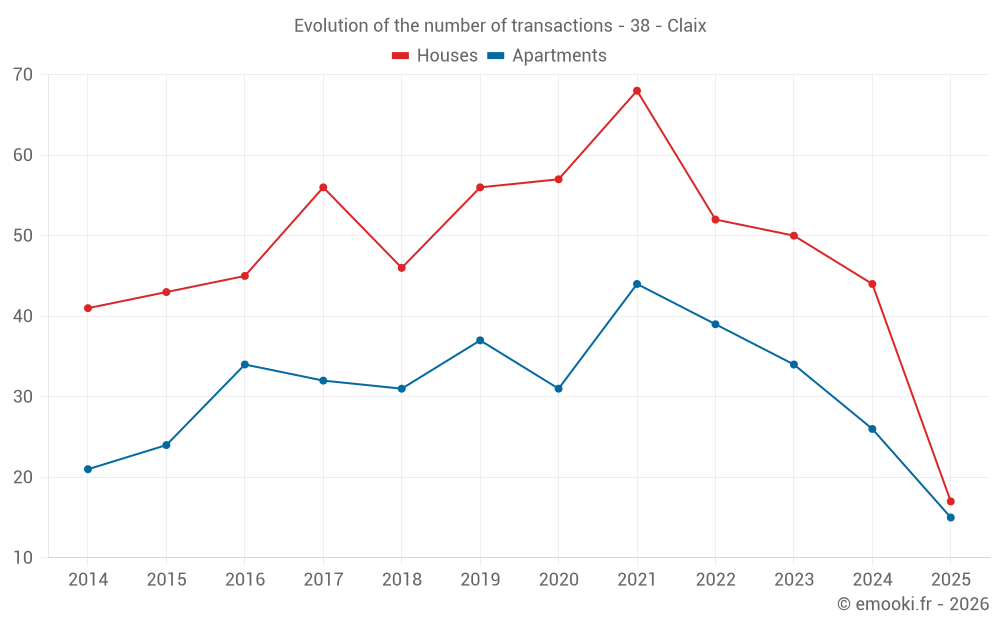
Median price on the 44 transactions of the last 12 months.
from 2 771 to
4 432 € /m²
60% of transactions from the 2nd to the 8th deciles.
ApartmentsApartments
3 400 € /m²
1-23-45-67-89-10
Reliability 8/10
Median price on the 30 transactions of the last 12 months.
from 2 803 to
3 978 € /m²
60% of transactions from the 2nd to the 8th deciles.
DwellingsDwellings
3 480 € /m²
1-23-45-67-89-10
Reliability 9/10
Median price on the 32 transactions of the last 6 months.
from 2 789 to
4 385 € /m²
60% of transactions from the 2nd to the 8th deciles.
HousesEvolution of the price per m² of houses since...
1 year
+10%
2 years
-1.4%
3 years
+5.7%
4 years
+5.9%
5 years
+13%
6 years
+19%
7 years
+29%
8 years
+35%
9 years
+35%
10 years
+28%
11 years
+42%
The price per m² of houses has decreased by 1.4% since 2 years, but it has increased by 42% in 11 years.
ApartmentsEvolution of the price per m² of apartments since...
1 year
-4.3%
2 years
-6.6%
3 years
+0.7%
4 years
+1.4%
5 years
+5%
6 years
+23%
7 years
+5.9%
8 years
+10%
9 years
+19%
10 years
+32%
11 years
+18%
The price per m² of apartments has decreased by 6.6% since 2 years, but it has increased by 32% in 10 years.

Yearly evolution

Evolution of the median price per m²

Evolution of the number of transactions

Warning, last year incomplete. Projections made based on the proportions between semesters of the previous year at the departmental/national level and by type of property.

Yearly data

Descending order
Year
Houses
house
transactions
Houses
house
Price per m²
Apartments
apt.
transactions
Apartments
apt.
Price per m²
2025
17
4 011 €
15
3 197 €
2024
44
3 652 €
26
3 340 €
2023
50
4 066 €
34
3 424 €
2022
52
3 796 €
39
3 176 €
2021
68
3 788 €
44
3 153 €
2020
57
3 558 €
31
3 044 €
2019
56
3 380 €
37
2 589 €
2018
46
3 116 €
31
3 020 €
2017
56
2 980 €
32
2 900 €
2016
45
2 965 €
34
2 678 €
2015
43
3 137 €
24
2 426 €
2014
41
2 815 €
21
2 717 €

Analysis

Structure of prices per m²

Values of price percentiles per m² over the periods used for the estimated price of each type of property.

Structure of transaction amounts

Values of transaction amounts percentiles over the periods used for the estimated price of each type of property.

Transaction amounts and prices per m² by percentile

Ascending order
Percentile
Houses
house
Price per m²
Houses
house
Transaction amount
Apartments
apt.
Price per m²
Apartments
apt.
Transaction amount
10th percentile
2 281 €
266 K€
2 441 €
138 K€
20th percentile
2 771 €
309 K€
2 803 €
184 K€
30th percentile
3 221 €
333 K€
3 027 €
193 K€
40th percentile
3 519 €
366 K€
3 097 €
206 K€
50th percentile
3 709 €
398 K€
3 400 €
230 K€
60th percentile
3 945 €
421 K€
3 444 €
263 K€
70th percentile
4 305 €
463 K€
3 950 €
300 K€
80th percentile
4 432 €
540 K€
3 978 €
317 K€
90th percentile
4 616 €
566 K€
4 612 €
333 K€

National and departmental comparison

Evolution of the median price per m² of houses

Evolution of the median price per m² of apartments

Quarterly evolution

Evolution of the median price per m²

Evolution of the number of transactions

Quarterly data

Descending order
Quarter
Houses
house
transactions
Houses
house
Price per m²
Apartments
apt.
transactions
Apartments
apt.
Price per m²
2025 Q2
3
4 358 €
6
3 307 €
2025 Q1
14
3 880 €
9
3 079 €
2024 Q4
9
3 889 €
7
3 580 €
2024 Q3
18
3 321 €
8
3 242 €
2024 Q2
6
3 596 €
4
2 946 €
2024 Q1
11
3 718 €
7
3 298 €
2023 Q4
12
3 616 €
13
3 175 €
2023 Q3
11
4 275 €
3
2 796 €
2023 Q2
12
4 075 €
8
3 512 €
2023 Q1
15
3 794 €
10
3 346 €
2022 Q4
12
3 815 €
12
3 116 €
2022 Q3
16
4 114 €
8
2 970 €
2022 Q2
10
3 648 €
8
3 324 €
2022 Q1
14
3 794 €
11
3 537 €
2021 Q4
18
4 142 €
10
3 287 €
2021 Q3
23
3 726 €
15
3 238 €
2021 Q2
17
3 176 €
12
3 040 €
2021 Q1
10
4 188 €
7
2 829 €
2020 Q4
22
3 400 €
11
2 565 €
2020 Q3
18
3 582 €
6
3 698 €
2020 Q2
8
3 838 €
7
3 000 €
2020 Q1
9
3 479 €
7
3 466 €
2019 Q4
17
3 379 €
11
2 679 €
2019 Q3
15
3 441 €
14
2 554 €
2019 Q2
18
3 358 €
4
3 846 €
2019 Q1
6
3 368 €
8
2 535 €
2018 Q4
15
3 619 €
5
2 982 €
2018 Q3
15
2 889 €
10
2 892 €
2018 Q2
5
3 222 €
8
3 190 €
2018 Q1
11
2 984 €
8
3 014 €
2017 Q4
15
3 000 €
6
3 400 €
2017 Q3
15
2 976 €
9
2 469 €
2017 Q2
14
3 110 €
8
2 560 €
2017 Q1
12
2 922 €
9
2 941 €
2016 Q4
15
2 788 €
8
2 729 €
2016 Q3
11
3 613 €
9
2 477 €
2016 Q2
7
2 947 €
7
2 727 €
2016 Q1
12
2 992 €
10
2 655 €
2015 Q4
17
3 273 €
6
2 509 €
2015 Q3
13
3 126 €
3
2 571 €
2015 Q2
8
3 132 €
11
2 333 €
2015 Q1
5
3 137 €
4
2 419 €
2014 Q4
13
2 869 €
5
2 639 €
2014 Q3
12
2 740 €
5
2 728 €
2014 Q2
7
2 500 €
4
2 363 €
2014 Q1
9
3 026 €
7
2 752 €

Overview of the latest real estate transactions

The following list is an anonymized overview of the latest transactions. For more details and to find all transactions, please use the map to view transactions by plot or the transaction search page for a search by criteria.

2025-06-04
4 500 €
Sale
Land
2000 m2
-Pâtures
/Pâture plantée
2025-05-30
380 000 €
4 471 € /m²(85 m²)
Sale
Houses
House
4 rooms
85 m2
Land
602 m2
-Sols
1 outbuilding
Land
114 m2
-Sols
2025-05-27
258 300 €
3 974 € /m²(65 m²)
Sale
1 outbuilding
Apartments
Apartment
3 rooms
65 m2
Land
11 m2
-Prés
2025-05-22
271 140 €
2 767 € /m²(98 m²)
Sale
Apartments
Apartment
4 rooms
98 m2
2 outbuildings
2025-05-19
800 000 €
1 212 € /m²(660 m²)
Sale
Land
359 m2
-Sols
Commercial property
660 m2
Land
1026 m2
-Sols
Land
16 m2
-Sols
2025-04-30
369 000 €
4 393 € /m²(84 m²)
Sale
Houses
House
5 rooms
84 m2
Land
885 m2
-Sols
Land
495 m2
-Sols
Land
1221 m2
-Sols
Land
497 m2
-Sols
Land
2274 m2
-Sols
2025-04-25
316 000 €
4 716 € /m²(67 m²)
Sale
Apartments
Apartment
3 rooms
67 m2
3 outbuildings
2025-04-25
2 964 062 €
Sale
Land
1193 m2
-Jardins
Land
583 m2
-Prés
Land
512 m2
-Prés
Land
833 m2
-Prés
Land
4366 m2
-Prés
Land
5670 m2
-Prés
Land
116 m2
-Prés
Land
1222 m2
-Prés
2025-04-25
150 000 €
Sale
Land
715 m2
-Sols
2025-04-18
299 100 €
3 084 € /m²(97 m²)
Sale
Apartments
Apartment
4 rooms
97 m2
2 outbuildings
Land
65 m2
-Sols
2025-04-11
278 900 €
4 358 € /m²(64 m²)
Sale
Houses
House
4 rooms
64 m2
Land
739 m2
-Sols
2025-04-10
12 000 €
Sale
1 outbuilding
2025-04-09
531 000 €
3 426 € /m²(155 m²)
Sale
Houses
House
5 rooms
155 m2
Land
777 m2
-Sols
Land
644 m2
-Landes
/Rocs ou rochers
2025-04-09
195 000 €
3 197 € /m²(61 m²)
Sale
Apartments
Apartment
3 rooms
61 m2
1 outbuilding
1 outbuilding
2025-04-04
239 200 €
3 417 € /m²(70 m²)
Sale
Apartments
Apartment
3 rooms
70 m2
2025-04-02
60 000 €
Sale
1 outbuilding
Land
81 m2
-Sols
2025-03-31
332 000 €
3 952 € /m²(84 m²)
Sale
Apartments
Apartment
4 rooms
84 m2
1 outbuilding
2025-03-28
316 800 €
2 437 € /m²(130 m²)
Sale
Houses
House
4 rooms
130 m2
1 outbuilding
2025-03-26
90 000 €
2 432 € /m²(37 m²)
Sale
Apartments
Apartment
1 room
37 m2
2025-03-25
337 000 €
4 012 € /m²(84 m²)
Sale
Apartments
Apartment
4 rooms
84 m2
3 outbuildings
1612 transactions listed in the municipality

Isère (38)

Most expensive cities

City
name
Descending orderHouses
house
Price per m²
8 262 €
5 712 €
4 917 €
4 777 €
4 676 €
4 663 €
4 610 €
4 575 €
4 516 €
4 506 €
City
name
Descending orderApartments
apt.
Price per m²
7 647 €
6 370 €
5 636 €
4 866 €
4 524 €
4 492 €
4 249 €
4 234 €
4 154 €
3 958 €

Least expensive cities

City
name
Ascending orderHouses
house
Price per m²
502 €
722 €
790 €
902 €
975 €
1 133 €
1 198 €
1 228 €
1 237 €
City
name
Ascending orderApartments
apt.
Price per m²
431 €
475 €
483 €
541 €
562 €
606 €