emooki
HomePrice mapTransactions
🇬🇧 English🇫🇷 Français🇩🇪 Deutsch🇪🇸 Español🇮🇹 Italiano

Real estate price map


Real estate price map in the municipality of Béziers.

Hérault (34)
Béziers

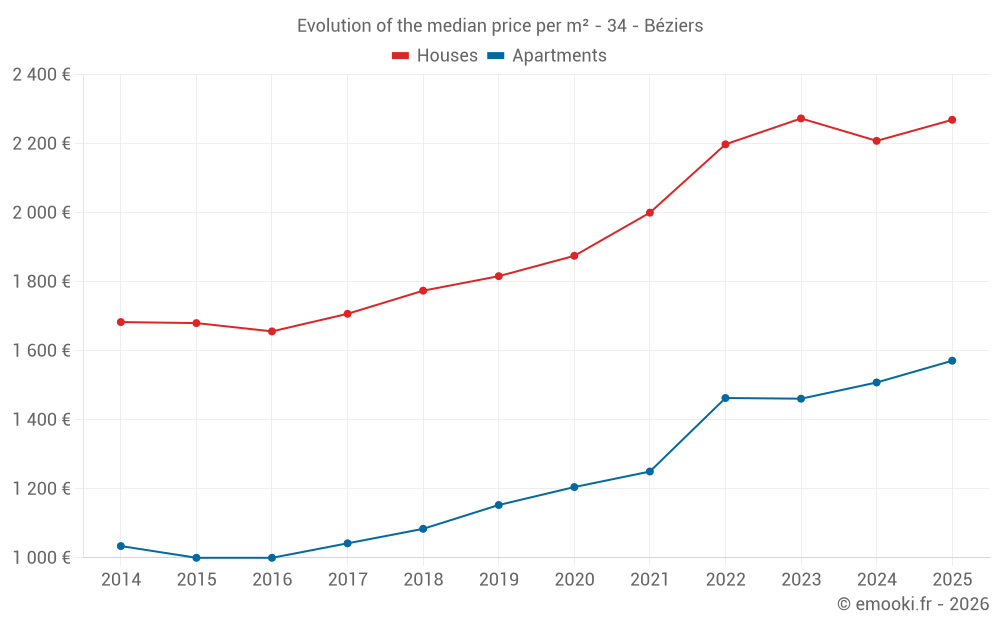
Median price of real estate
in the municipality of Béziers

HousesHouses
2 241  /m²
1-23-45-67-89-10
Reliability 10/10
Median price on the 44 transactions of the last 3 months.
from 1 545 to
2 832  /m²
60% of transactions from the 2nd to the 8th deciles.
ApartmentsApartments
1 515  /m²
1-23-45-67-89-10
Reliability 10/10
Median price on the 91 transactions of the last 3 months.
from 1 087 to
2 083  /m²
60% of transactions from the 2nd to the 8th deciles.
DwellingsDwellings
1 755  /m²
1-23-45-67-89-10
Reliability 10/10
Median price on the 135 transactions of the last 3 months.
from 1 134 to
2 342  /m²
60% of transactions from the 2nd to the 8th deciles.
HousesEvolution of the price per m² of houses since...
1 year
+2.8%
2 years
-0.2%
3 years
+3.2%
4 years
+13%
5 years
+21%
6 years
+25%
7 years
+28%
8 years
+33%
9 years
+37%
10 years
+35%
11 years
+35%
ApartmentsEvolution of the price per m² of apartments since...
1 year
+4.2%
2 years
+7.5%
3 years
+7.4%
4 years
+26%
5 years
+30%
6 years
+36%
7 years
+45%
8 years
+51%
9 years
+57%
10 years
+57%
11 years
+52%

Yearly evolution

Evolution of the median price per m²

Evolution of the number of transactions

Warning, last year incomplete. Projections made based on the proportions between semesters of the previous year at the departmental/national level and by type of property.

Yearly data

Descending order
Year
Houses
house
transactions
Houses
house
Price per m²
Apartments
apt.
transactions
Apartments
apt.
Price per m²
2025
171
2 269 
351
1 571 
2024
467
2 208 
901
1 508 
2023
469
2 273 
969
1 461 
2022
672
2 198 
1 137
1 463 
2021
635
2 000 
1 117
1 250 
2020
524
1 875 
921
1 205 
2019
509
1 816 
902
1 153 
2018
488
1 774 
789
1 084 
2017
517
1 707 
758
1 042 
2016
402
1 656 
673
1 000 
2015
414
1 680 
625
1 000 
2014
353
1 683 
517
1 034 

Analysis

Structure of prices per m²

Values of price percentiles per m² over the periods used for the estimated price of each type of property.

Structure of transaction amounts

Values of transaction amounts percentiles over the periods used for the estimated price of each type of property.

Transaction amounts and prices per m² by percentile

Ascending order
Percentile
Houses
house
Price per m²
Houses
house
Transaction amount
Apartments
apt.
Price per m²
Apartments
apt.
Transaction amount
10th percentile
1 120 
90 000 
880 
48 000 
20th percentile
1 545 
132 K
1 087 
59 200 
30th percentile
1 922 
159 K
1 241 
74 500 
40th percentile
2 146 
170 K
1 364 
84 150 
50th percentile
2 241 
182 K
1 515 
92 000 
60th percentile
2 395 
200 K
1 707 
118 K
70th percentile
2 643 
257 K
1 874 
137 K
80th percentile
2 832 
316 K
2 083 
163 K
90th percentile
3 536 
454 K
2 293 
215 K

National and departmental comparison

Evolution of the median price per m² of houses

Evolution of the median price per m² of apartments

Quarterly evolution

Evolution of the median price per m²

Evolution of the number of transactions

Quarterly data

Descending order
Quarter
Houses
house
transactions
Houses
house
Price per m²
Apartments
apt.
transactions
Apartments
apt.
Price per m²
2025 Q2
44
2 241 
91
1 515 
2025 Q1
127
2 273 
260
1 582 
2024 Q4
134
2 314 
266
1 667 
2024 Q3
115
2 223 
242
1 458 
2024 Q2
112
2 142 
207
1 500 
2024 Q1
106
2 200 
186
1 410 
2023 Q4
104
2 288 
237
1 408 
2023 Q3
109
2 254 
232
1 530 
2023 Q2
133
2 320 
254
1 442 
2023 Q1
123
2 257 
246
1 438 
2022 Q4
146
2 298 
287
1 534 
2022 Q3
184
2 228 
290
1 455 
2022 Q2
186
2 250 
293
1 447 
2022 Q1
156
2 075 
267
1 417 
2021 Q4
161
1 958 
304
1 242 
2021 Q3
183
2 020 
303
1 310 
2021 Q2
139
2 030 
286
1 292 
2021 Q1
152
1 956 
224
1 166 
2020 Q4
179
1 874 
293
1 236 
2020 Q3
129
1 865 
225
1 200 
2020 Q2
103
1 896 
202
1 186 
2020 Q1
113
1 941 
201
1 190 
2019 Q4
153
1 841 
213
1 190 
2019 Q3
138
1 822 
256
1 090 
2019 Q2
113
1 758 
208
1 157 
2019 Q1
105
1 833 
225
1 213 
2018 Q4
137
1 778 
250
1 148 
2018 Q3
145
1 854 
187
1 069 
2018 Q2
117
1 689 
173
1 176 
2018 Q1
89
1 771 
179
959 
2017 Q4
139
1 829 
192
1 039 
2017 Q3
125
1 702 
187
1 022 
2017 Q2
139
1 685 
209
1 040 
2017 Q1
114
1 676 
170
1 114 
2016 Q4
97
1 750 
186
993 
2016 Q3
119
1 728 
184
1 025 
2016 Q2
103
1 501 
177
1 029 
2016 Q1
83
1 573 
126
896 
2015 Q4
114
1 663 
184
1 104 
2015 Q3
110
1 770 
160
1 046 
2015 Q2
103
1 627 
149
1 029 
2015 Q1
87
1 687 
132
926 
2014 Q4
101
1 618 
115
957 
2014 Q3
98
1 766 
141
1 034 
2014 Q2
72
1 690 
120
1 067 
2014 Q1
82
1 618 
141
1 105 

Hérault (34)

Most expensive cities

City
name
Descending orderHouses
house
Price per m²
6 604 
6 267 
4 826 
4 550 
4 500 
4 436 
4 422 
4 418 
City
name
Descending orderApartments
apt.
Price per m²
5 318 
4 953 
4 917 
4 496 
4 294 
4 214 
4 145 

Least expensive cities

City
name
Ascending orderHouses
house
Price per m²
426 
684 
848 
1 008 
City
name
Ascending orderApartments
apt.
Price per m²
267 
302 
308 
337 
338 
448 
454 
481