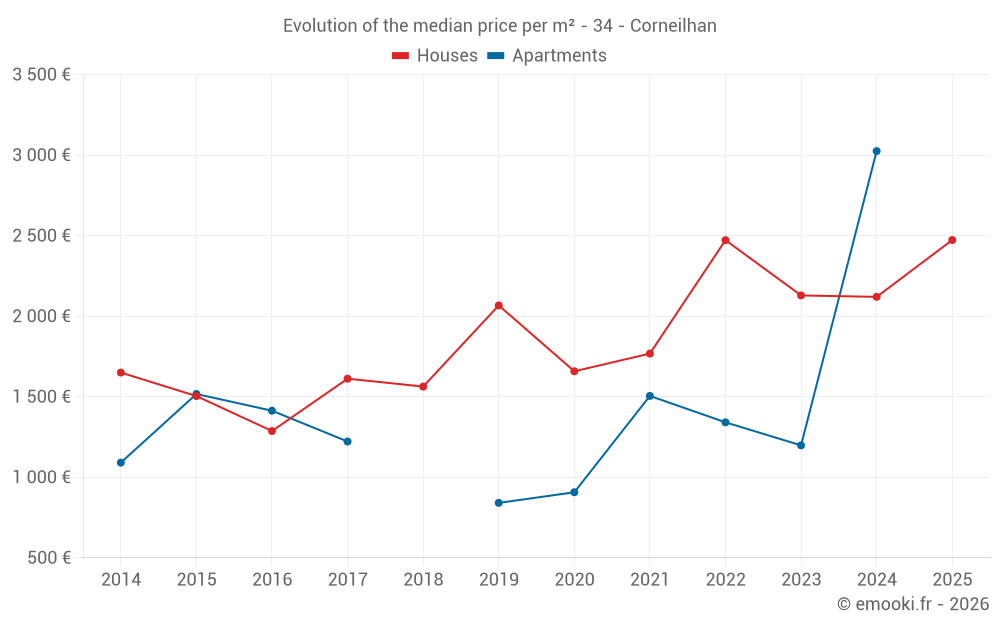
Median price of real estate
in the municipality of Corneilhan
Houses
2 208 € /m²
Reliability 8/10
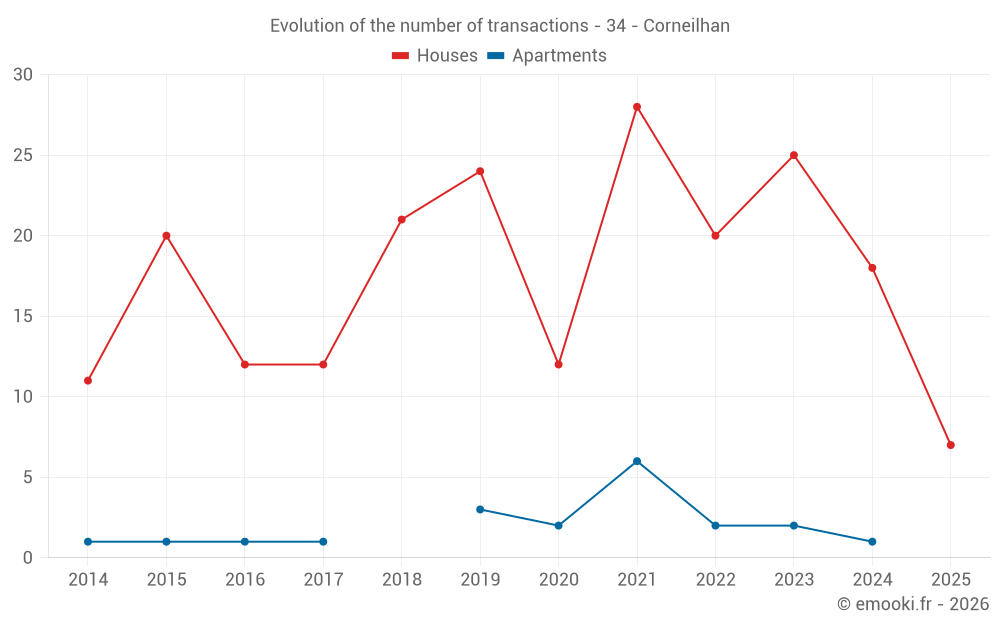
Median price on the 20 transactions of the last 12 months.
from 1 308 to
2 677 € /m²
2 677 € /m²
60% of transactions from the 2nd to the 8th deciles.
Apartments
1 279 € /m²
Reliability 4/10
Median price on the 12 transactions of the last 60 months.
from 692 to
1 905 € /m²
1 905 € /m²
60% of transactions from the 2nd to the 8th deciles.
Dwellings
2 208 € /m²
Reliability 8/10
Median price on the 20 transactions of the last 12 months.
from 1 308 to
2 677 € /m²
2 677 € /m²
60% of transactions from the 2nd to the 8th deciles.