Median price of real estate
in the municipality of Boujan-sur-Libron
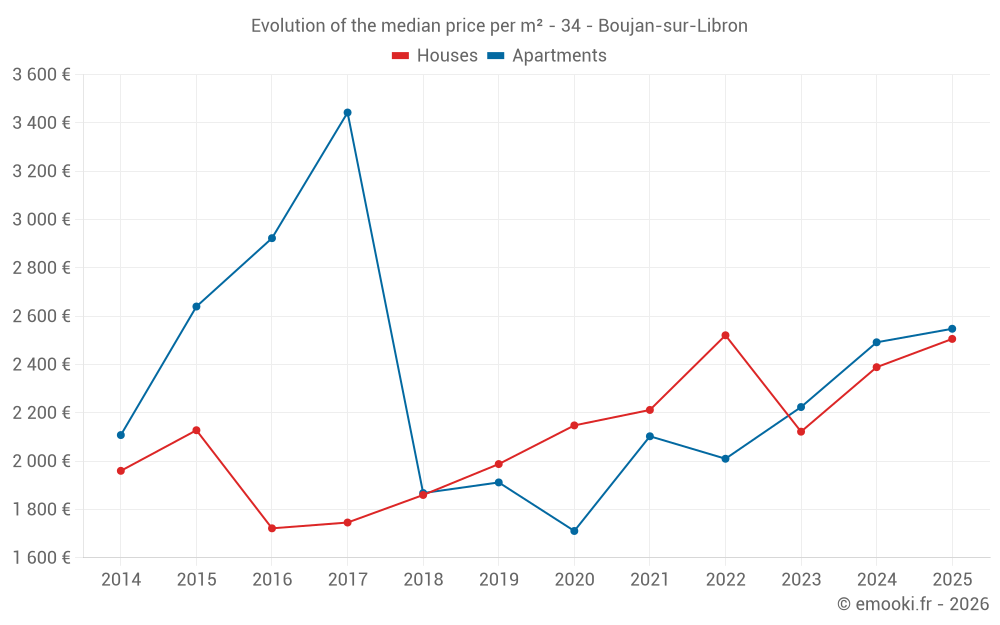
Houses
2 042 € /m²
Reliability 8/10
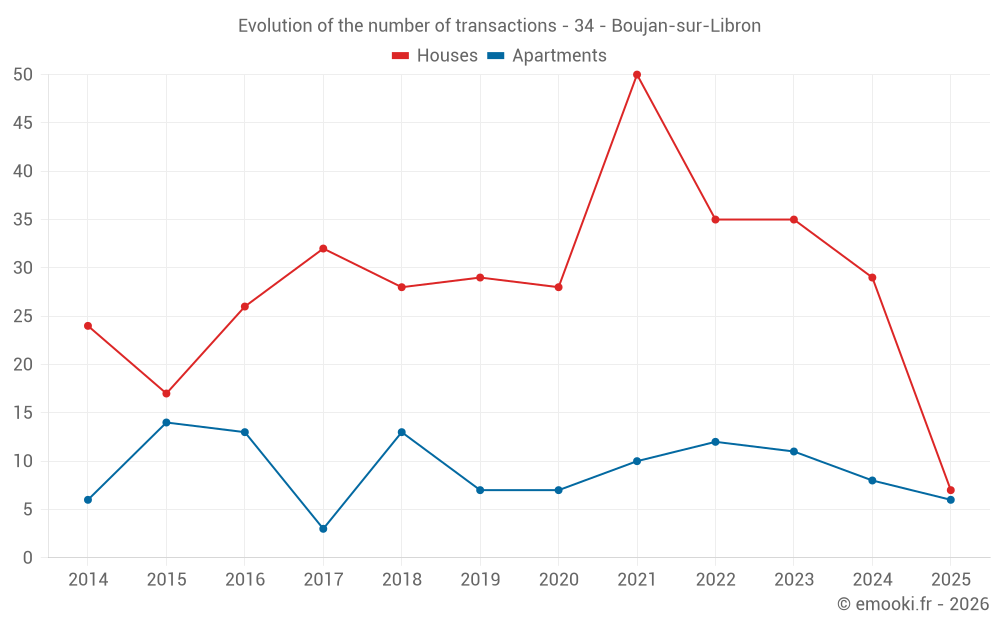
Median price on the 27 transactions of the last 12 months.
from 1 412 to
2 774 € /m²
2 774 € /m²
60% of transactions from the 2nd to the 8th deciles.
Apartments
2 476 € /m²
Reliability 7/10
Median price on the 20 transactions of the last 24 months.
from 2 129 to
3 077 € /m²
3 077 € /m²
60% of transactions from the 2nd to the 8th deciles.
Dwellings
2 332 € /m²
Reliability 8/10
Median price on the 38 transactions of the last 12 months.
from 1 559 to
2 984 € /m²
2 984 € /m²
60% of transactions from the 2nd to the 8th deciles.