emooki
HomePrice mapTransactions
🇬🇧 English🇫🇷 Français🇩🇪 Deutsch🇪🇸 Español🇮🇹 Italiano

Real estate price map


Real estate price map in the municipality of Saint-Christol-lez-Alès.

Gard (30)
Saint-Christol-lez-Alès

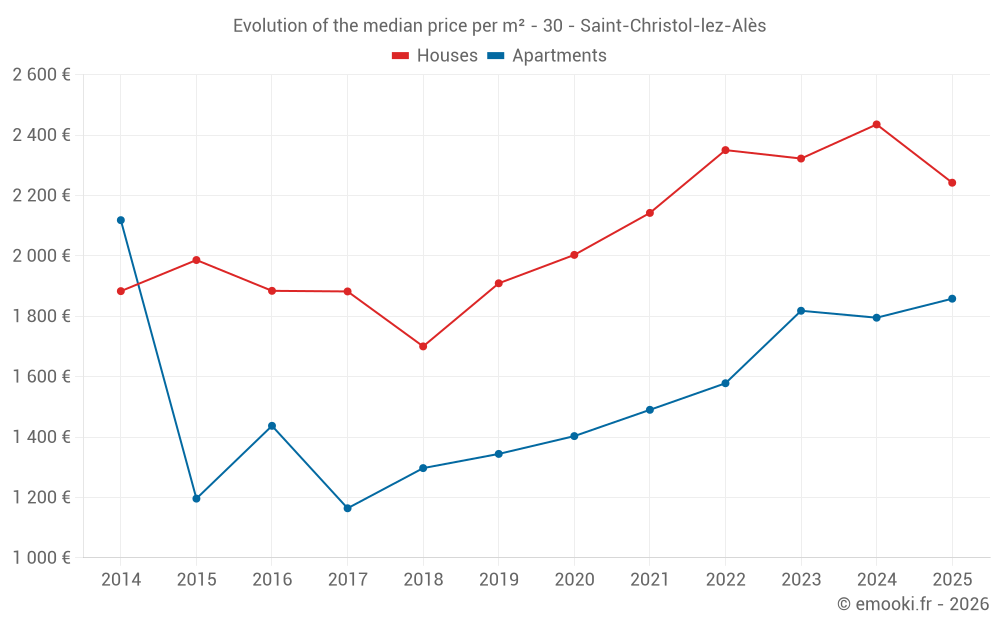
Median price of real estate
in the municipality of Saint-Christol-lez-Alès

HousesHouses
2 242  /m²
1-23-45-67-89-10
Reliability 9/10
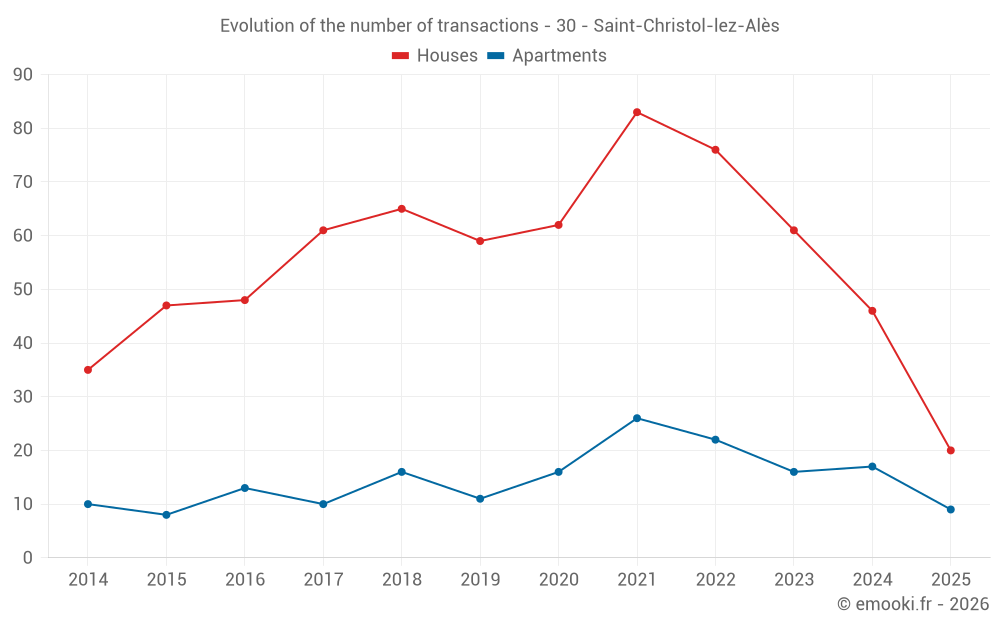
Median price on the 20 transactions of the last 6 months.
from 1 817 to
2 613  /m²
60% of transactions from the 2nd to the 8th deciles.
ApartmentsApartments
1 819  /m²
1-23-45-67-89-10
Reliability 8/10
Median price on the 19 transactions of the last 12 months.
from 1 697 to
2 283  /m²
60% of transactions from the 2nd to the 8th deciles.
DwellingsDwellings
2 188  /m²
1-23-45-67-89-10
Reliability 9/10
Median price on the 29 transactions of the last 6 months.
from 1 712 to
2 599  /m²
60% of transactions from the 2nd to the 8th deciles.
HousesEvolution of the price per m² of houses since...
1 year
-7.9%
2 years
-3.4%
3 years
-4.6%
4 years
+4.7%
5 years
+12%
6 years
+17%
7 years
+32%
8 years
+19%
9 years
+19%
10 years
+13%
11 years
+19%
ApartmentsEvolution of the price per m² of apartments since...
1 year
+3.5%
2 years
+2.2%
3 years
+18%
4 years
+25%
5 years
+32%
6 years
+38%
7 years
+43%
8 years
+60%
9 years
+29%
10 years
+55%
11 years
-12%

Yearly evolution

Evolution of the median price per m²

Evolution of the number of transactions

Warning, last year incomplete. Projections made based on the proportions between semesters of the previous year at the departmental/national level and by type of property.

Yearly data

Descending order
Year
Houses
house
transactions
Houses
house
Price per m²
Apartments
apt.
transactions
Apartments
apt.
Price per m²
2025
20
2 242 
9
1 858 
2024
46
2 435 
17
1 795 
2023
61
2 322 
16
1 818 
2022
76
2 350 
22
1 578 
2021
83
2 142 
26
1 490 
2020
62
2 003 
16
1 403 
2019
59
1 909 
11
1 344 
2018
65
1 700 
16
1 297 
2017
61
1 882 
10
1 164 
2016
48
1 884 
13
1 437 
2015
47
1 986 
8
1 196 
2014
35
1 883 
10
2 118 

Analysis

Structure of prices per m²

Values of price percentiles per m² over the periods used for the estimated price of each type of property.

Structure of transaction amounts

Values of transaction amounts percentiles over the periods used for the estimated price of each type of property.

Transaction amounts and prices per m² by percentile

Ascending order
Percentile
Houses
house
Price per m²
Houses
house
Transaction amount
Apartments
apt.
Price per m²
Apartments
apt.
Transaction amount
10th percentile
1 182 
151 K
1 615 
66 600 
20th percentile
1 817 
174 K
1 697 
76 000 
30th percentile
1 966 
186 K
1 706 
87 000 
40th percentile
2 142 
200 K
1 780 
95 200 
50th percentile
2 242 
210 K
1 819 
120 K
60th percentile
2 282 
226 K
1 918 
125 K
70th percentile
2 508 
229 K
2 118 
133 K
80th percentile
2 613 
240 K
2 283 
146 K
90th percentile
2 668 
290 K
2 477 
180 K

National and departmental comparison

Evolution of the median price per m² of houses

Evolution of the median price per m² of apartments

Quarterly evolution

Evolution of the median price per m²

Evolution of the number of transactions

Quarterly data

Descending order
Quarter
Houses
house
transactions
Houses
house
Price per m²
Apartments
apt.
transactions
Apartments
apt.
Price per m²
2025 Q2
7
2 331 
3
1 933 
2025 Q1
13
2 188 
6
1 838 
2024 Q4
12
2 540 
6
1 919 
2024 Q3
9
2 464 
4
1 707 
2024 Q2
16
2 414 
4
1 819 
2024 Q1
9
2 349 
3
1 969 
2023 Q4
17
2 591 
5
2 101 
2023 Q3
14
2 652 
0
--- 
2023 Q2
17
2 230 
5
1 633 
2023 Q1
13
2 229 
6
1 834 
2022 Q4
14
2 429 
4
1 462 
2022 Q3
24
2 434 
7
1 633 
2022 Q2
19
2 250 
6
1 169 
2022 Q1
19
2 323 
5
1 633 
2021 Q4
19
2 152 
9
1 568 
2021 Q3
28
2 212 
6
1 570 
2021 Q2
24
2 022 
5
1 402 
2021 Q1
12
2 197 
6
1 422 
2020 Q4
25
2 118 
6
1 446 
2020 Q3
14
1 663 
3
1 328 
2020 Q2
10
1 906 
4
1 424 
2020 Q1
13
1 959 
3
1 410 
2019 Q4
17
1 891 
3
1 344 
2019 Q3
21
2 000 
4
1 345 
2019 Q2
12
2 046 
1
515 
2019 Q1
9
1 800 
3
1 550 
2018 Q4
13
1 713 
3
1 777 
2018 Q3
13
1 750 
4
1 101 
2018 Q2
18
1 565 
7
1 290 
2018 Q1
21
1 676 
2
1 426 
2017 Q4
18
1 844 
3
1 408 
2017 Q3
14
2 046 
3
1 143 
2017 Q2
16
1 708 
3
1 186 
2017 Q1
13
1 665 
1
1 143 
2016 Q4
10
2 188 
6
1 653 
2016 Q3
14
2 057 
3
889 
2016 Q2
15
1 628 
1
1 857 
2016 Q1
9
1 818 
3
1 437 
2015 Q4
18
2 048 
3
1 143 
2015 Q3
8
1 920 
1
1 193 
2015 Q2
12
1 994 
2
1 310 
2015 Q1
9
1 748 
2
2 442 
2014 Q4
6
2 294 
0
--- 
2014 Q3
13
1 854 
3
2 500 
2014 Q2
10
1 771 
1
581 
2014 Q1
6
2 242 
6
1 826 

Gard (30)

Most expensive cities

City
name
Descending orderHouses
house
Price per m²
4 483 
4 034 
3 942 
3 835 
3 606 
3 505 
City
name
Descending orderApartments
apt.
Price per m²
5 174 
5 102 
3 626 
3 553 
3 286 
3 112 
2 994 
2 960 

Least expensive cities

City
name
Ascending orderHouses
house
Price per m²
838 
846 
988 
1 057 
1 135 
1 140 
1 216 
1 226 
City
name
Ascending orderApartments
apt.
Price per m²
188 
208 
300 
340 
438 
558 
600