emooki
HomePrice mapTransactions
🇬🇧 English🇫🇷 Français🇩🇪 Deutsch🇪🇸 Español🇮🇹 Italiano

Real estate price map


Real estate price map in the municipality of Ribaute-les-Tavernes, choose a section to see transactions by parcel.

Gard (30)

Ribaute-les-Tavernes - Real estate price m²

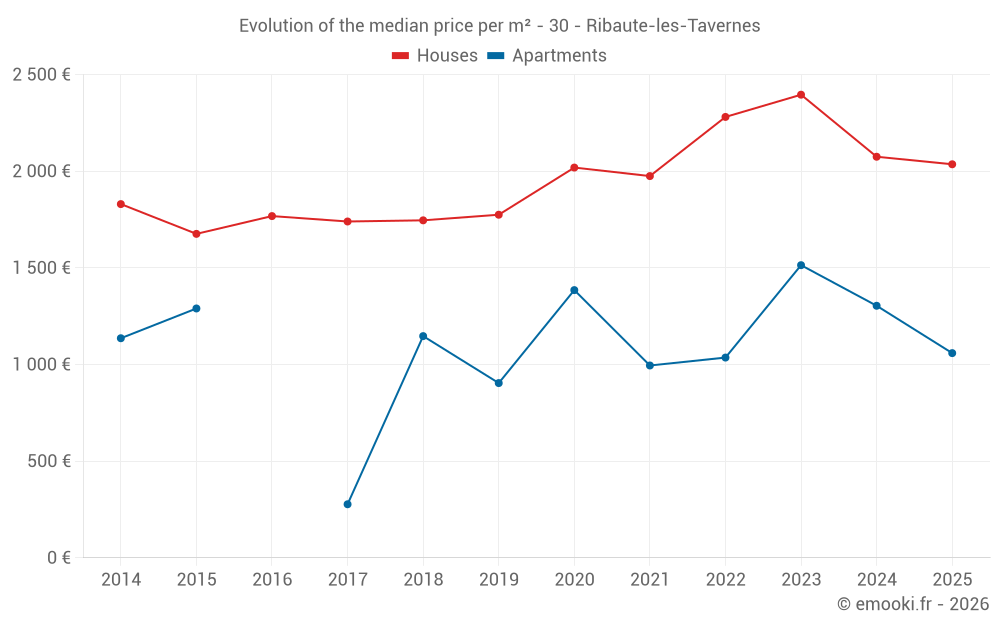
Median price of real estate
in the municipality of Ribaute-les-Tavernes

HousesHouses
2 121  /m²
1-23-45-67-89-10
Reliability 7/10
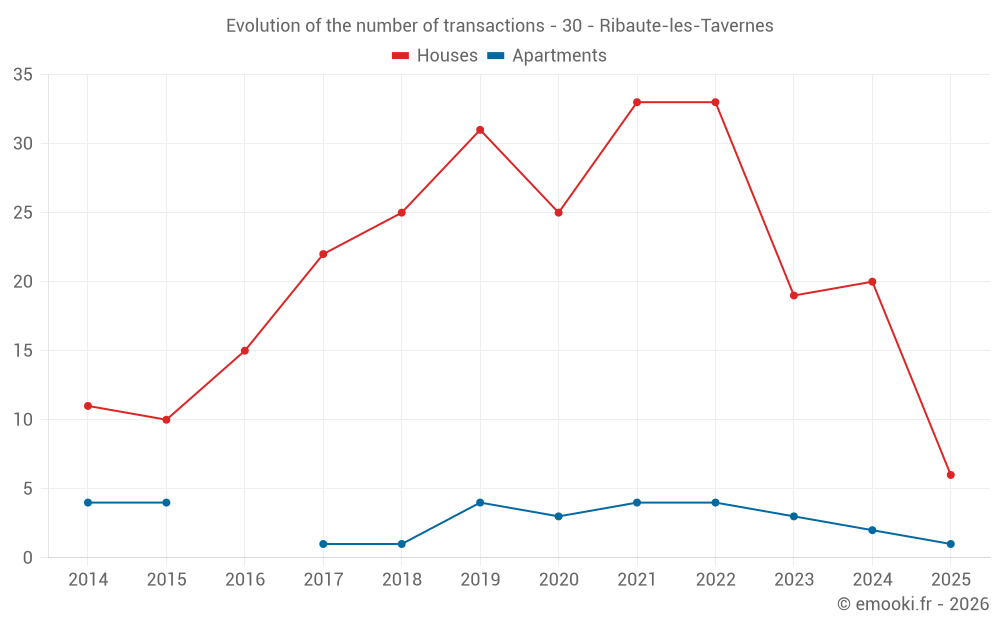
Median price on the 36 transactions of the last 24 months.
from 1 800 to
2 284  /m²
60% of transactions from the 2nd to the 8th deciles.
ApartmentsApartments
1 276  /m²
1-23-45-67-89-10
Reliability 5/10
Median price on the 13 transactions of the last 48 months.
from 983 to
1 519  /m²
60% of transactions from the 2nd to the 8th deciles.
DwellingsDwellings
2 074  /m²
1-23-45-67-89-10
Reliability 7/10
Median price on the 39 transactions of the last 24 months.
from 1 488 to
2 274  /m²
60% of transactions from the 2nd to the 8th deciles.
HousesEvolution of the price per m² of houses since...
1 year
-1.9%
2 years
-15%
3 years
-11%
4 years
+3.1%
5 years
+0.8%
6 years
+15%
7 years
+17%
8 years
+17%
9 years
+15%
10 years
+21%
11 years
+11%
The price per m² of houses has decreased by 15% since 2 years, but it has increased by 21% in 10 years.

Yearly evolution

Evolution of the median price per m²

Evolution of the median price per m² - 30 - Ribaute-les-Tavernes

Evolution of the number of transactions

Warning, last year incomplete. Projections made based on the proportions between semesters of the previous year at the departmental/national level and by type of property.

Evolution of the number of transactions - 30 - Ribaute-les-Tavernes

Yearly data

Descending order
Year
Houses
house
transactions
Houses
house
Price per m²
Apartments
apt.
transactions
Apartments
apt.
Price per m²
2025
6
2 036 
1
1 059 
2024
20
2 075 
2
1 304 
2023
19
2 396 
3
1 514 
2022
33
2 281 
4
1 036 
2021
33
1 975 
4
995 
2020
25
2 019 
3
1 385 
2019
31
1 775 
4
904 
2018
25
1 746 
1
1 147 
2017
22
1 740 
1
277 
2016
15
1 768 
0
--- 
2015
10
1 676 
4
1 290 
2014
11
1 830 
4
1 136 

Analysis

Structure of prices per m²

Values of price percentiles per m² over the periods used for the estimated price of each type of property.

Structure of transaction amounts

Values of transaction amounts percentiles over the periods used for the estimated price of each type of property.

Transaction amounts and prices per m² by percentile

Ascending order
Percentile
Houses
house
Price per m²
Houses
house
Transaction amount
Apartments
apt.
Price per m²
Apartments
apt.
Transaction amount
10th percentile
1 369 
112 K
627 
61 200 
20th percentile
1 800 
128 K
983 
86 400 
30th percentile
1 829 
147 K
1 057 
98 400 
40th percentile
1 914 
188 K
1 195 
141 K
50th percentile
2 121 
196 K
1 276 
160 K
60th percentile
2 162 
214 K
1 379 
212 K
70th percentile
2 249 
249 K
1 434 
228 K
80th percentile
2 284 
272 K
1 519 
246 K
90th percentile
2 602 
308 K
1 628 
250 K

National and departmental comparison

Evolution of the median price per m² of houses

Evolution of the median price per m² of apartments

Quarterly evolution

Evolution of the median price per m²

Evolution of the number of transactions

Quarterly data

Descending order
Quarter
Houses
house
transactions
Houses
house
Price per m²
Apartments
apt.
transactions
Apartments
apt.
Price per m²
2025 Q1
6
2 036 
1
1 059 
2024 Q4
2
1 705 
1
1 229 
2024 Q3
4
2 200 
0
--- 
2024 Q2
5
2 246 
0
--- 
2024 Q1
9
1 811 
1
1 379 
2023 Q4
6
2 235 
0
--- 
2023 Q3
4
2 252 
0
--- 
2023 Q2
4
2 359 
1
1 514 
2023 Q1
5
2 535 
2
1 518 
2022 Q4
8
2 480 
2
1 022 
2022 Q3
7
2 248 
1
550 
2022 Q2
13
2 281 
0
--- 
2022 Q1
5
2 151 
1
3 121 
2021 Q4
11
1 844 
1
1 276 
2021 Q3
6
2 308 
2
995 
2021 Q2
8
2 194 
1
807 
2021 Q1
8
1 890 
0
--- 
2020 Q4
9
2 250 
1
1 369 
2020 Q3
7
2 063 
1
1 817 
2020 Q2
6
1 828 
1
1 385 
2020 Q1
3
2 011 
0
--- 
2019 Q4
6
1 772 
3
922 
2019 Q3
7
2 051 
0
--- 
2019 Q2
11
1 775 
1
484 
2019 Q1
7
1 718 
0
--- 
2018 Q4
6
1 584 
1
1 147 
2018 Q3
6
1 934 
0
--- 
2018 Q2
6
1 726 
0
--- 
2018 Q1
7
1 597 
0
--- 
2017 Q4
4
2 034 
0
--- 
2017 Q3
5
2 043 
1
277 
2017 Q2
11
1 653 
0
--- 
2017 Q1
2
1 790 
0
--- 
2016 Q4
5
1 667 
0
--- 
2016 Q3
3
2 444 
0
--- 
2016 Q2
5
1 548 
0
--- 
2016 Q1
2
1 638 
0
--- 
2015 Q4
2
2 008 
0
--- 
2015 Q3
2
1 620 
2
1 290 
2015 Q2
2
1 481 
2
1 482 
2015 Q1
4
1 776 
0
--- 
2014 Q4
2
2 108 
0
--- 
2014 Q3
4
1 786 
2
1 100 
2014 Q2
1
2 065 
1
1 273 
2014 Q1
4
1 320 
1
1 000 

Overview of the latest real estate transactions

The following list is an anonymized overview of the latest transactions. For more details and to find all transactions, please use the map to view transactions by plot or the transaction search page for a search by criteria.

2025-06-16
100 000 
Sale
Land
1250 m2
-Terres
Land
513 m2
-Terres
2025-05-26
3 200 
Sale
Land
1056 m2
-Terres
/Légumière de plein champ
2025-05-07
5 500 
Sale
Land
1557 m2
-Landes
/Pâture plantée
Land
3987 m2
-Terres
2025-03-20
3 120 
Sale
Land
156 m2
-Sols
2025-03-19
6 000 
Sale
Land
2310 m2
-Terres
Land
3628 m2
-Terres
2025-03-18
200 400 
2 252  /m²(89 m²)
Sale
Houses
House
3 rooms
89 m2
Land
1095 m2
-Sols
2025-03-17
192 000 
2 157  /m²(89 m²)
Sale
Houses
House
5 rooms
89 m2
Land
585 m2
-Sols
Land
3 m2
-Sols
2025-03-17
1 
Sale
Land
96 m2
-Sols
2025-03-06
114 000 
1 200  /m²(95 m²)
Sale
Houses
House
4 rooms
95 m2
2 outbuildings
Land
445 m2
-Sols
2025-03-05
3 520 
Sale
Land
2864 m2
-Landes
Land
3075 m2
-Taillis simples
/Chênes -verts
Land
2855 m2
-Terres
/Légumière de plein champ
2025-03-03
95 710 
1 914  /m²(50 m²)
Sale
Houses
House
2 rooms
50 m2
Land
106 m2
-Sols
Land
140 m2
-Sols
Land
10 m2
-Sols
Land
153 m2
-Taillis simples
/Acacias
Land
105 m2
-Sols
2025-02-21
6 000 
Sale
Land
4510 m2
-Vergers
Land
3855 m2
-Vergers
Land
2160 m2
-Terres
Land
774 m2
-Taillis simples
/Chênes -verts
Land
604 m2
-Taillis simples
/Chênes -verts
2025-02-19
140 000 
1 667  /m²(84 m²)
Sale
Houses
House
4 rooms
84 m2
Land
174 m2
-Sols
2025-02-19
232 800 
2 238  /m²(104 m²)
Sale
Houses
House
5 rooms
104 m2
Land
790 m2
-Sols
Land
2224 m2
-Sols
Land
38 m2
-Sols
Land
2148 m2
-Sols
Land
147 m2
-Sols
Land
267 m2
-Sols
Land
169 m2
-Sols
2025-01-24
13 102 
Sale
Land
2735 m2
-Landes
/Pâture plantée
Land
4770 m2
-Terres
Land
6890 m2
-Terres
Land
1165 m2
-Taillis simples
/Chênes -verts
Land
4718 m2
-Terres
2025-01-24
60 000 
Sale
Land
120 m2
-Sols
2025-01-21
219 200 
1 059  /m²(207 m²)
Sale
Apartments
Apartment
3 rooms
92 m2
Apartments
Apartment
4 rooms
115 m2
Land
1065 m2
-Sols
2024-12-19
237 950 
1 803  /m²(132 m²)
2 356  /m²(101 m²)
Sale
Houses
House
4 rooms
101 m2
Commercial property
31 m2
Land
1000 m2
-Sols
2024-12-13
124 800 
1 248  /m²(100 m²)
Sale
Houses
House
4 rooms
100 m2
1 outbuilding
Land
723 m2
-Sols
Land
137 m2
-Sols
2024-12-12
75 000 
Sale
Land
855 m2
-Terres
631 transactions listed in the municipality

Gard (30)

Most expensive cities

City
name
Descending orderHouses
house
Price per m²
4 483 
4 034 
3 942 
3 835 
3 606 
3 505 
City
name
Descending orderApartments
apt.
Price per m²
5 174 
5 102 
3 626 
3 553 
3 286 
3 112 
2 994 
2 960 

Least expensive cities

City
name
Ascending orderHouses
house
Price per m²
838 
846 
988 
1 057 
1 135 
1 140 
1 216 
1 226 
City
name
Ascending orderApartments
apt.
Price per m²
188 
208 
300 
340 
438 
558 
600