emooki
HomePrice mapTransactions
🇬🇧 English🇫🇷 Français🇩🇪 Deutsch🇪🇸 Español🇮🇹 Italiano

Real estate price map


Real estate price map in the municipality of Saint-Évarzec.

Finistère (29)
Saint-Évarzec

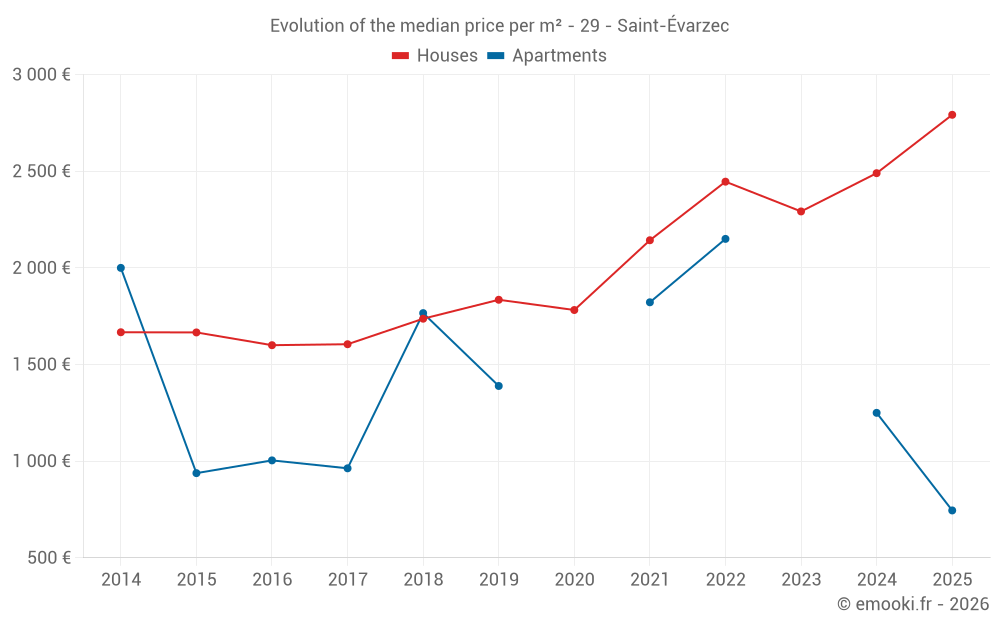
Median price of real estate
in the municipality of Saint-Évarzec

HousesHouses
2 778  /m²
1-23-45-67-89-10
Reliability 8/10
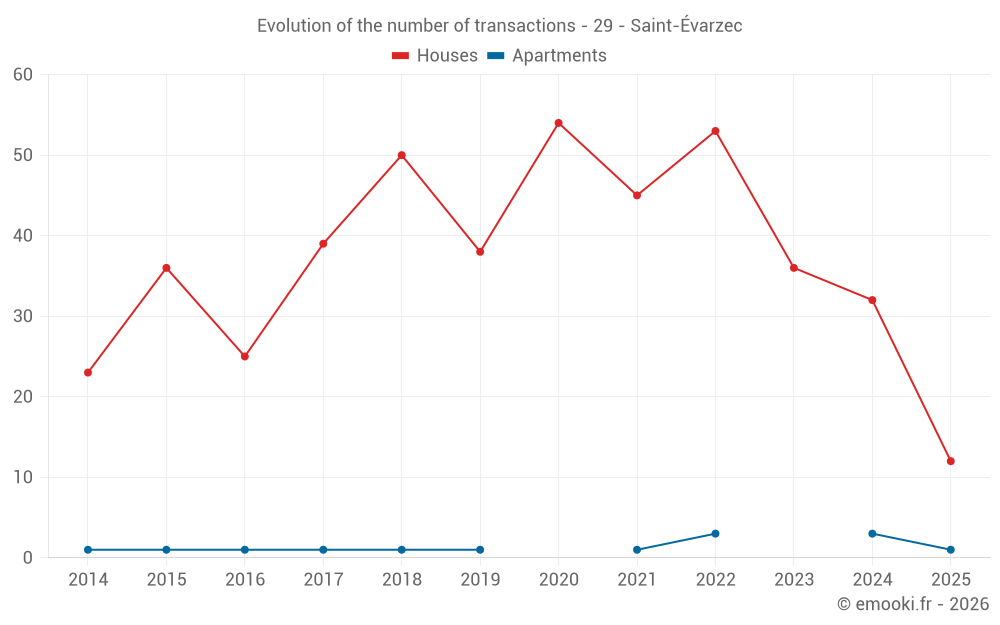
Median price on the 29 transactions of the last 12 months.
from 1 886 to
3 162  /m²
60% of transactions from the 2nd to the 8th deciles.
ApartmentsApartments
1 722  /m²
1-23-45-67-89-10
Reliability 4/10
Median price on the 8 transactions of the last 60 months.
DwellingsDwellings
2 636  /m²
1-23-45-67-89-10
Reliability 8/10
Median price on the 32 transactions of the last 12 months.
from 1 254 to
3 032  /m²
60% of transactions from the 2nd to the 8th deciles.
HousesEvolution of the price per m² of houses since...
1 year
+12%
2 years
+22%
3 years
+14%
4 years
+30%
5 years
+57%
6 years
+52%
7 years
+61%
8 years
+74%
9 years
+75%
10 years
+68%
11 years
+67%
ApartmentsEvolution of the price per m² of apartments since...
1 year
--
2 years
--
3 years
--
4 years
--
5 years
--
6 years
--
7 years
--
8 years
--
9 years
--
10 years
--
11 years
--

Yearly evolution

Evolution of the median price per m²

Evolution of the number of transactions

Warning, last year incomplete. Projections made based on the proportions between semesters of the previous year at the departmental/national level and by type of property.

Yearly data

Descending order
Year
Houses
house
transactions
Houses
house
Price per m²
Apartments
apt.
transactions
Apartments
apt.
Price per m²
2025
12
2 792 
1
745 
2024
32
2 490 
3
1 250 
2023
36
2 292 
0
--- 
2022
53
2 446 
3
2 150 
2021
45
2 143 
1
1 822 
2020
54
1 782 
0
--- 
2019
38
1 835 
1
1 389 
2018
50
1 737 
1
1 766 
2017
39
1 605 
1
963 
2016
25
1 600 
1
1 004 
2015
36
1 666 
1
938 
2014
23
1 667 
1
2 000 

Analysis

Structure of prices per m²

Values of price percentiles per m² over the periods used for the estimated price of each type of property.

Structure of transaction amounts

Values of transaction amounts percentiles over the periods used for the estimated price of each type of property.

Transaction amounts and prices per m² by percentile

Ascending order
Percentile
Houses
house
Price per m²
Houses
house
Transaction amount
Apartments
apt.
Price per m²
Apartments
apt.
Transaction amount
10th percentile
1 133 
139 K
1 080 
68 500 
20th percentile
1 886 
201 K
1 234 
74 300 
30th percentile
2 126 
235 K
1 287 
83 425 
40th percentile
2 563 
266 K
1 548 
102 K
50th percentile
2 778 
285 K
1 722 
108 K
60th percentile
2 796 
295 K
1 888 
108 K
70th percentile
2 911 
317 K
2 117 
108 K
80th percentile
3 162 
344 K
2 337 
109 K
90th percentile
3 529 
384 K
2 530 
146 K

National and departmental comparison

Evolution of the median price per m² of houses

Evolution of the median price per m² of apartments

Quarterly evolution

Evolution of the median price per m²

Evolution of the number of transactions

Quarterly data

Descending order
Quarter
Houses
house
transactions
Houses
house
Price per m²
Apartments
apt.
transactions
Apartments
apt.
Price per m²
2025 Q2
1
2 784 
0
--- 
2025 Q1
11
2 799 
1
745 
2024 Q4
11
2 166 
1
1 250 
2024 Q3
6
2 589 
1
1 223 
2024 Q2
4
2 200 
0
--- 
2024 Q1
11
2 585 
1
2 688 
2023 Q4
16
2 242 
0
--- 
2023 Q3
6
2 453 
0
--- 
2023 Q2
7
2 222 
0
--- 
2023 Q1
7
2 478 
0
--- 
2022 Q4
12
2 563 
1
2 150 
2022 Q3
16
2 546 
0
--- 
2022 Q2
18
2 374 
2
2 042 
2022 Q1
7
2 333 
0
--- 
2021 Q4
14
2 196 
1
1 822 
2021 Q3
12
2 684 
0
--- 
2021 Q2
12
2 086 
0
--- 
2021 Q1
7
1 860 
0
--- 
2020 Q4
18
1 887 
0
--- 
2020 Q3
8
1 792 
0
--- 
2020 Q2
16
1 739 
0
--- 
2020 Q1
12
1 756 
0
--- 
2019 Q4
9
1 909 
0
--- 
2019 Q3
6
1 856 
1
1 389 
2019 Q2
8
1 918 
0
--- 
2019 Q1
15
1 800 
0
--- 
2018 Q4
13
1 650 
1
1 766 
2018 Q3
11
1 756 
0
--- 
2018 Q2
12
1 868 
0
--- 
2018 Q1
14
1 642 
0
--- 
2017 Q4
12
1 568 
0
--- 
2017 Q3
5
1 545 
1
963 
2017 Q2
8
1 678 
0
--- 
2017 Q1
14
1 606 
0
--- 
2016 Q4
5
1 554 
0
--- 
2016 Q3
6
1 703 
0
--- 
2016 Q2
8
1 364 
1
1 004 
2016 Q1
6
1 858 
0
--- 
2015 Q4
11
1 622 
0
--- 
2015 Q3
10
1 670 
0
--- 
2015 Q2
11
1 798 
0
--- 
2015 Q1
4
1 518 
1
938 
2014 Q4
5
1 715 
0
--- 
2014 Q3
7
1 535 
1
2 000 
2014 Q2
4
1 176 
0
--- 
2014 Q1
7
1 705 
0
--- 

Finistère (29)

Most expensive cities

City
name
Descending orderHouses
house
Price per m²
3 989 
3 766 
3 461 
3 428 
3 146 
3 102 
3 044 
2 965 
City
name
Descending orderApartments
apt.
Price per m²
4 592 
4 260 
4 097 
3 933 
3 778 
3 210 
3 200 
3 066 

Least expensive cities

City
name
Ascending orderHouses
house
Price per m²
750 
792 
793 
830 
878 
889 
934 
935 
943 
City
name
Ascending orderApartments
apt.
Price per m²
200 
232 
312 
320 
339 
365 
388 
399 
415