emooki

Real estate price map


Real estate price map in the municipality of Clohars-Fouesnant, choose a section to see transactions by parcel.

Finistère (29)

Price per m² in Clohars-Fouesnant

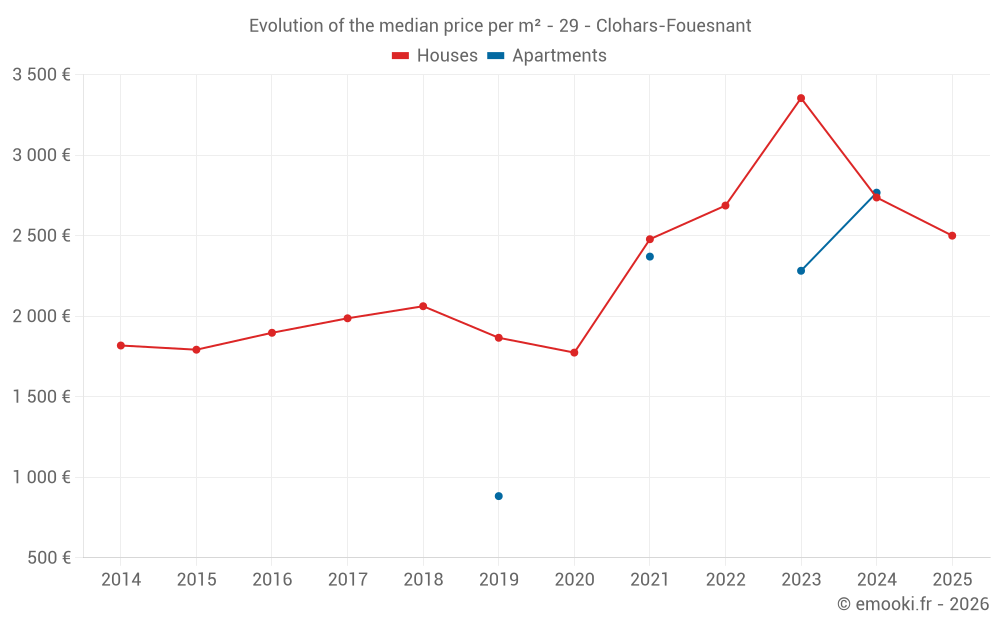
Median price of real estate
in the municipality of Clohars-Fouesnant

HousesHouses
2 624  /m²
1-23-45-67-89-10
Reliability 8/10
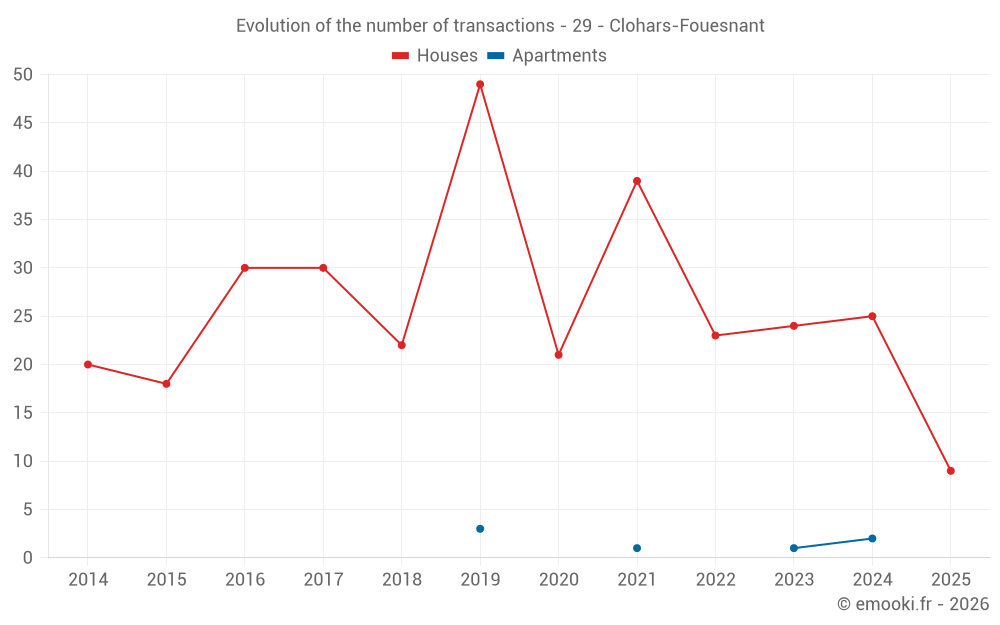
Median price on the 26 transactions of the last 12 months.
from 2 011 to
3 021  /m²
60% of transactions from the 2nd to the 8th deciles.
ApartmentsApartments
2 033  /m²
1-23-45-67-89-10
Reliability 3/10
Median price on the 6 transactions of the last 72 months.
DwellingsDwellings
2 625  /m²
1-23-45-67-89-10
Reliability 8/10
Median price on the 27 transactions of the last 12 months.
from 2 051 to
3 199  /m²
60% of transactions from the 2nd to the 8th deciles.
HousesEvolution of the price per m² of houses since...
1 year
-8.7%
2 years
-25%
3 years
-7%
4 years
+0.9%
5 years
+41%
6 years
+34%
7 years
+21%
8 years
+26%
9 years
+32%
10 years
+40%
11 years
+38%
The price per m² of houses has decreased by 25% since 2 years, but it has increased by 41% in 5 years.

505 transactions listed in the municipality

Yearly data

Yearly evolution of the median price per m²

Yearly evolution of the median price per m² - 29 - Clohars-Fouesnant

Yearly evolution of the number of transactions

Warning, last year incomplete. Projections made based on the proportions between semesters of the previous year at the departmental/national level and by type of property.

Yearly evolution of the number of transactions - 29 - Clohars-Fouesnant

Yearly table

Descending order
Year
Houses
house
transactions
Houses
house
Price per m²
Apartments
apt.
transactions
Apartments
apt.
Price per m²
2025
9
2 500 
0
--- 
2024
25
2 737 
2
2 767 
2023
24
3 354 
1
2 282 
2022
23
2 687 
0
--- 
2021
39
2 478 
1
2 370 
2020
21
1 774 
0
--- 
2019
49
1 866 
3
883 
2018
22
2 062 
0
--- 
2017
30
1 987 
0
--- 
2016
30
1 897 
0
--- 
2015
18
1 792 
0
--- 
2014
20
1 818 
0
--- 

Analysis

Structure of prices per m²

Values of price percentiles per m² over the periods used for the estimated price of each type of property.

Structure of transaction amounts

Values of transaction amounts percentiles over the periods used for the estimated price of each type of property.

Transaction amounts and prices per m² by percentile

Ascending order
Percentile
Houses
house
Price per m²
Houses
house
Transaction amount
Apartments
apt.
Price per m²
Apartments
apt.
Transaction amount
10th percentile
1 440 
132 K
1 172 
128 K
20th percentile
2 011 
185 K
1 461 
150 K
30th percentile
2 388 
191 K
1 622 
195 K
40th percentile
2 553 
221 K
1 784 
241 K
50th percentile
2 624 
258 K
2 033 
242 K
60th percentile
2 689 
290 K
2 282 
244 K
70th percentile
2 760 
328 K
2 326 
402 K
80th percentile
3 021 
342 K
2 370 
559 K
90th percentile
3 859 
377 K
3 060 
562 K

National and departmental comparison

Evolution of the median price per m² of houses

Evolution of the median price per m² of apartments

Quarterly data

Quarterly evolution of the median price per m²

Quarterly evolution of the number of transactions

Quarterly table

Descending order
Quarter
Houses
house
transactions
Houses
house
Price per m²
Apartments
apt.
transactions
Apartments
apt.
Price per m²
2025 Q2
2
2 616 
0
--- 
2025 Q1
7
2 500 
0
--- 
2024 Q4
7
2 689 
1
3 750 
2024 Q3
10
2 654 
0
--- 
2024 Q2
6
3 244 
1
1 784 
2024 Q1
2
3 280 
0
--- 
2023 Q4
13
3 376 
0
--- 
2023 Q3
6
2 794 
0
--- 
2023 Q2
2
4 405 
0
--- 
2023 Q1
3
2 545 
1
2 282 
2022 Q4
4
1 476 
0
--- 
2022 Q3
8
3 082 
0
--- 
2022 Q2
7
2 687 
0
--- 
2022 Q1
4
2 810 
0
--- 
2021 Q4
6
2 490 
1
2 370 
2021 Q3
13
2 787 
0
--- 
2021 Q2
9
2 505 
0
--- 
2021 Q1
11
2 400 
0
--- 
2020 Q4
5
1 774 
0
--- 
2020 Q3
8
2 148 
0
--- 
2020 Q2
2
1 330 
0
--- 
2020 Q1
6
1 216 
0
--- 
2019 Q4
14
1 970 
1
883 
2019 Q3
14
1 634 
1
1 461 
2019 Q2
8
1 876 
0
--- 
2019 Q1
13
1 912 
1
858 
2018 Q4
6
2 476 
0
--- 
2018 Q3
2
1 822 
0
--- 
2018 Q2
8
2 084 
0
--- 
2018 Q1
6
1 712 
0
--- 
2017 Q4
8
1 987 
0
--- 
2017 Q3
11
2 111 
0
--- 
2017 Q2
5
1 807 
0
--- 
2017 Q1
6
1 692 
0
--- 
2016 Q4
11
1 795 
0
--- 
2016 Q3
8
1 893 
0
--- 
2016 Q2
6
1 944 
0
--- 
2016 Q1
5
2 270 
0
--- 
2015 Q4
6
1 834 
0
--- 
2015 Q3
5
1 824 
0
--- 
2015 Q2
5
1 808 
0
--- 
2015 Q1
2
1 492 
0
--- 
2014 Q4
3
2 267 
0
--- 
2014 Q3
6
1 804 
0
--- 
2014 Q2
6
1 570 
0
--- 
2014 Q1
5
1 732 
0
--- 

Key takeaways

  • QuestionWhat is the price per m2 of houses in Clohars-Fouesnant?

    The median price on the 26 house transactions of the last 12 months in the municipality of Clohars-Fouesnant was 2 624 € per square meter for a median property value of 257 500 €. Over this period, 60% of transactions were between 2 011 and 3 021 € per square meter (from the 2nd to the 8th deciles).

Compare with neighboring municipalities

City
name
Descending orderHouses
house
Price per m²
Apartments
apt.
Price per m²
3 461 
3 036 
3 428 
3 933 
2 933 
1 812 
2 821 
1 938 
2 820 
4 097 
2 778 
1 722 
2 662 
2 923 
2 624 
2 033 
2 534 
2 405 
2 218 
2 381 

City information

Zip code

  • 29950 CLOHARS FOUESNANT