Real estate price map
Real estate price map in the municipality of Plonévez-du-Faou, choose a section to see transactions by parcel.
Finistère (29)
Price per m² in Plonévez-du-Faou
Median price of real estate
in the municipality of Plonévez-du-Faou
Houses
1 374 € /m²
Reliability 9/10
Median price on the 26 transactions of the last 6 months.
from 753 to
1 968 € /m²
1 968 € /m²
60% of transactions from the 2nd to the 8th deciles.
Apartments
356 € /m²
Reliability 2/10
Median price on the 5 transactions of the last 96 months.
Dwellings
1 374 € /m²
Reliability 9/10
Median price on the 26 transactions of the last 6 months.
from 753 to
1 968 € /m²
1 968 € /m²
60% of transactions from the 2nd to the 8th deciles.
Evolution of the price per m² of houses since...
1 year
+12%
2 years
+7.1%
3 years
+5.3%
4 years
+60%
5 years
+61%
6 years
+47%
7 years
+82%
8 years
+57%
9 years
+71%
10 years
+49%
11 years
+63%
1059 transactions listed in the municipality
Yearly data
Yearly evolution of the median price per m²

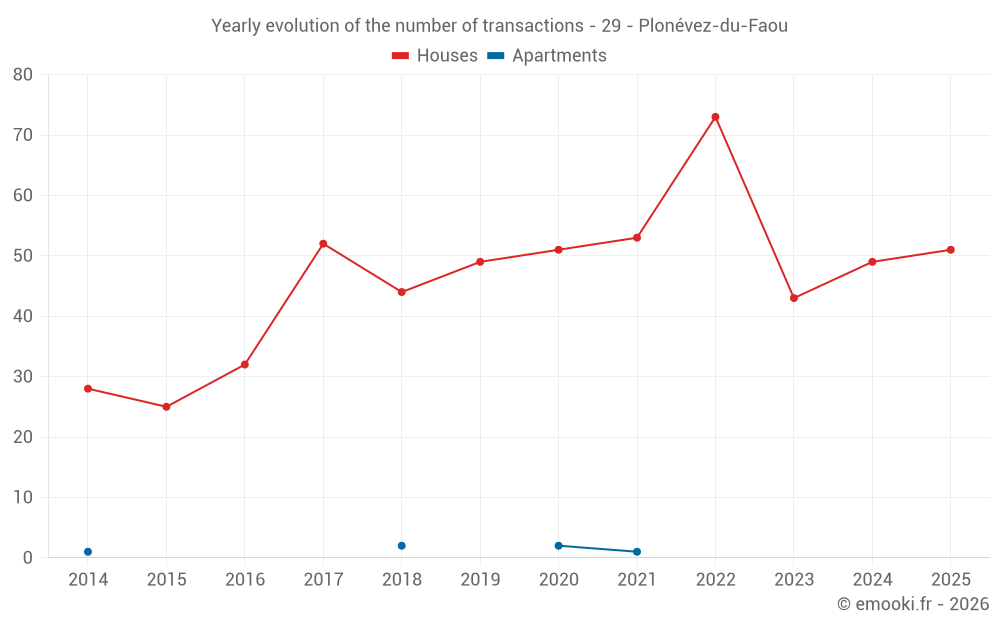
Yearly evolution of the number of transactions
Yearly table
Year
house
transactions
transactions
house
Price per m²
Price per m²
apt.
transactions
transactions
apt.
Price per m²
Price per m²
2025
51
1 206 €
0
--- €
2024
49
1 076 €
0
--- €
2023
43
1 126 €
0
--- €
2022
73
1 145 €
0
--- €
2021
53
754 €
1
174 €
2020
51
750 €
2
400 €
2019
49
822 €
0
--- €
2018
44
662 €
2
413 €
2017
52
767 €
0
--- €
2016
32
706 €
0
--- €
2015
25
812 €
0
--- €
2014
28
742 €
1
834 €
Analysis
Structure of prices per m²
Values of price percentiles per m² over the periods used for the estimated price of each type of property.
Structure of transaction amounts
Values of transaction amounts percentiles over the periods used for the estimated price of each type of property.
Transaction amounts and prices per m² by percentile
Percentile
house
Price per m²
Price per m²
house
Transaction amount
Transaction amount
apt.
Price per m²
Price per m²
apt.
Transaction amount
Transaction amount
10th percentile
392 €
32 500 €
229 €
22 041 €
20th percentile
753 €
45 200 €
284 €
28 580 €
30th percentile
925 €
71 000 €
321 €
31 880 €
40th percentile
1 206 €
85 000 €
338 €
31 940 €
50th percentile
1 374 €
110 K€
356 €
32 000 €
60th percentile
1 567 €
122 K€
391 €
44 000 €
70th percentile
1 823 €
149 K€
426 €
56 000 €
80th percentile
1 968 €
198 K€
458 €
69 400 €
90th percentile
2 283 €
215 K€
486 €
84 200 €
National and departmental comparison
Evolution of the median price per m² of houses
Evolution of the median price per m² of apartments
Quarterly data
Quarterly evolution of the median price per m²
Quarterly evolution of the number of transactions
Quarterly table
Quarter
house
transactions
transactions
house
Price per m²
Price per m²
apt.
transactions
transactions
apt.
Price per m²
Price per m²
2025 Q4
7
1 567 €
0
--- €
2025 Q3
19
1 333 €
0
--- €
2025 Q2
17
1 158 €
0
--- €
2025 Q1
8
1 218 €
0
--- €
2024 Q4
14
1 198 €
0
--- €
2024 Q3
14
1 233 €
0
--- €
2024 Q2
13
1 000 €
0
--- €
2024 Q1
8
1 053 €
0
--- €
2023 Q4
13
1 126 €
0
--- €
2023 Q3
7
1 189 €
0
--- €
2023 Q2
13
1 135 €
0
--- €
2023 Q1
10
952 €
0
--- €
2022 Q4
17
1 008 €
0
--- €
2022 Q3
20
1 134 €
0
--- €
2022 Q2
19
1 221 €
0
--- €
2022 Q1
17
1 417 €
0
--- €
2021 Q4
7
754 €
1
174 €
2021 Q3
13
580 €
0
--- €
2021 Q2
15
735 €
0
--- €
2021 Q1
18
892 €
0
--- €
2020 Q4
18
811 €
0
--- €
2020 Q3
13
883 €
2
400 €
2020 Q2
11
586 €
0
--- €
2020 Q1
9
328 €
0
--- €
2019 Q4
17
754 €
0
--- €
2019 Q3
14
798 €
0
--- €
2019 Q2
8
986 €
0
--- €
2019 Q1
10
774 €
0
--- €
2018 Q4
12
692 €
0
--- €
2018 Q3
11
712 €
1
312 €
2018 Q2
14
646 €
1
514 €
2018 Q1
7
542 €
0
--- €
2017 Q4
8
808 €
0
--- €
2017 Q3
17
698 €
0
--- €
2017 Q2
8
661 €
0
--- €
2017 Q1
19
865 €
0
--- €
2016 Q4
7
797 €
0
--- €
2016 Q3
10
616 €
0
--- €
2016 Q2
10
686 €
0
--- €
2016 Q1
5
1 035 €
0
--- €
2015 Q4
5
417 €
0
--- €
2015 Q3
8
850 €
0
--- €
2015 Q2
8
525 €
0
--- €
2015 Q1
4
1 230 €
0
--- €
2014 Q4
4
404 €
0
--- €
2014 Q3
10
742 €
1
834 €
2014 Q2
6
751 €
0
--- €
2014 Q1
8
833 €
0
--- €
Key takeaways
What is the price per m2 of houses in Plonévez-du-Faou?
The median price on the 26 house transactions of the last 6 months in the municipality of Plonévez-du-Faou was 1 374 € per square meter for a median property value of 110 446 €. Over this period, 60% of transactions were between 753 and 1 968 € per square meter (from the 2nd to the 8th deciles).
Compare with neighboring municipalities
City
name
name
house
Price per m²
Price per m²
apt.
Price per m²
Price per m²
City information
Zip code
- 29530 PLONEVEZ DU FAOU