Median price of real estate
in the municipality of Plouhinec
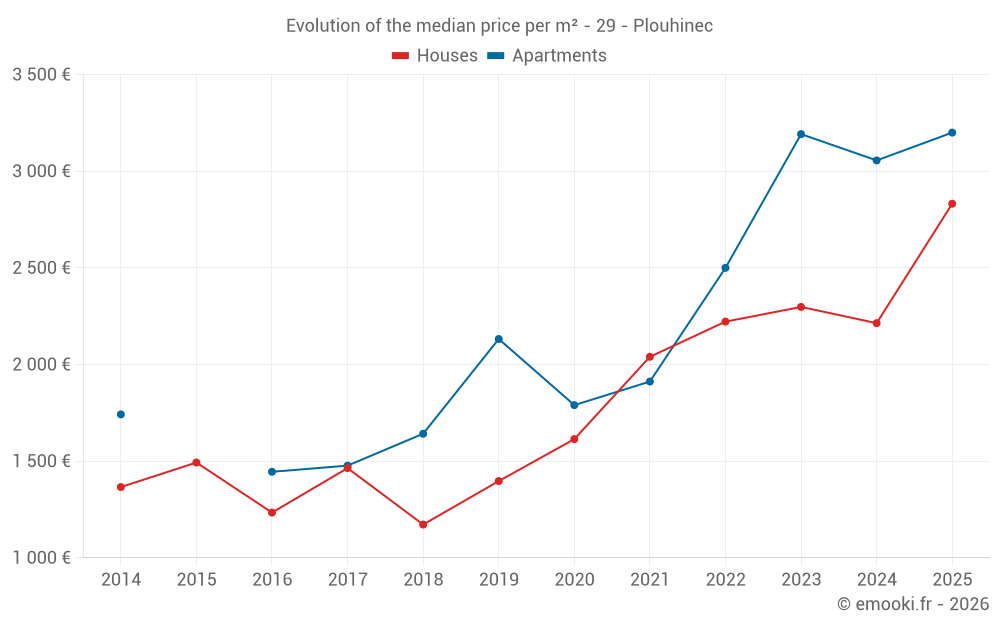
Houses
2 832 € /m²
Reliability 9/10
Median price on the 25 transactions of the last 6 months.
from 1 800 to
4 083 € /m²
4 083 € /m²
60% of transactions from the 2nd to the 8th deciles.
Apartments
3 066 € /m²
Reliability 6/10
Median price on the 16 transactions of the last 36 months.
from 2 157 to
3 629 € /m²
3 629 € /m²
60% of transactions from the 2nd to the 8th deciles.
Dwellings
2 915 € /m²
Reliability 9/10
Median price on the 26 transactions of the last 6 months.
from 1 859 to
4 020 € /m²
4 020 € /m²
60% of transactions from the 2nd to the 8th deciles.