emooki
HomePrice mapTransactions
🇬🇧 English🇫🇷 Français🇩🇪 Deutsch🇪🇸 Español🇮🇹 Italiano

Real estate price map


Real estate price map in the municipality of Loctudy, choose a section to see transactions by parcel.

Finistère (29)

Loctudy - Real estate price m²

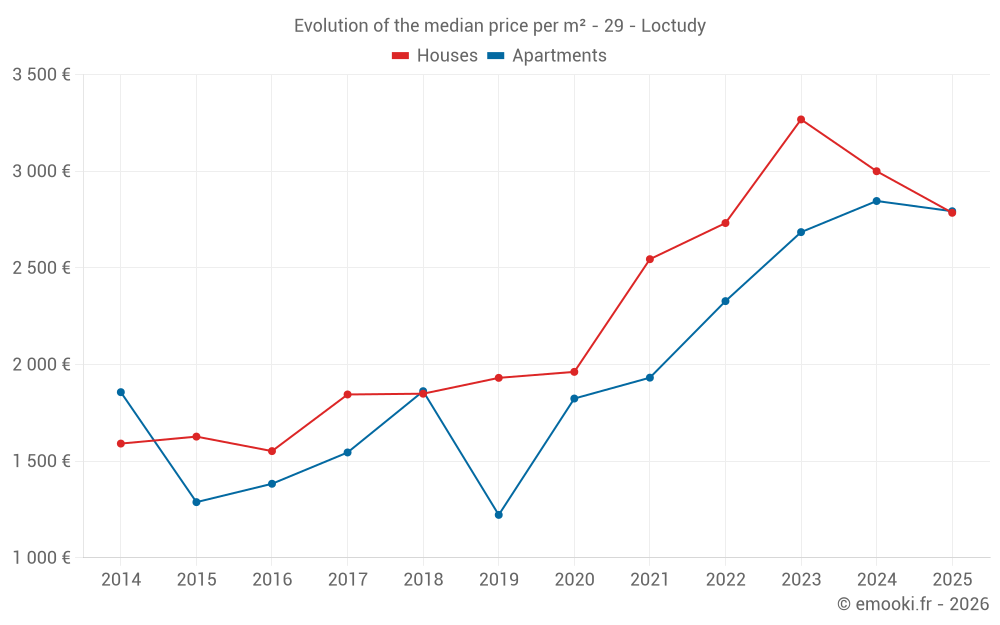
Median price of real estate
in the municipality of Loctudy

HousesHouses
2 785  /m²
1-23-45-67-89-10
Reliability 9/10
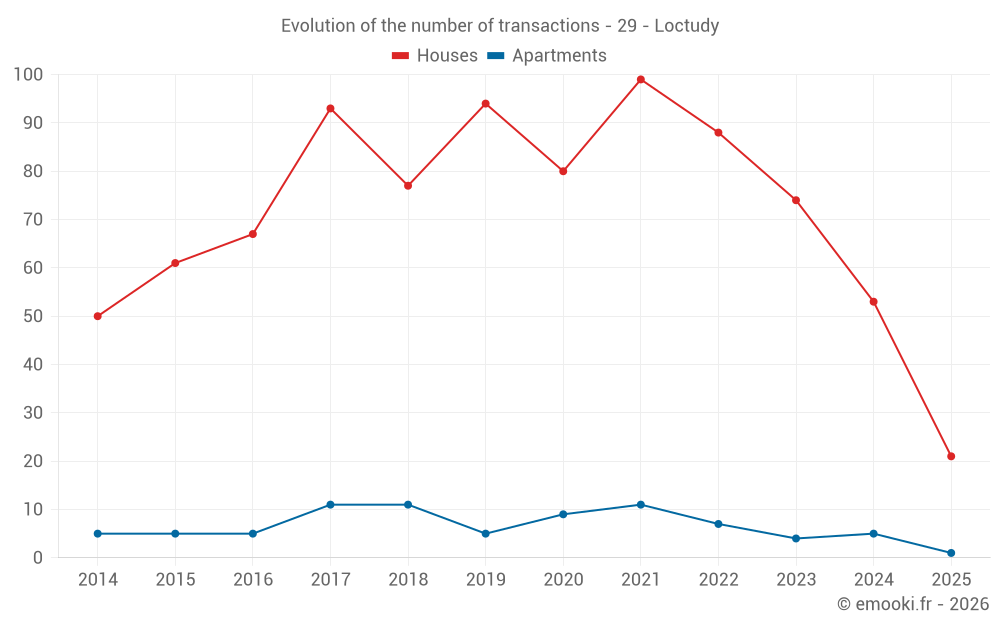
Median price on the 21 transactions of the last 6 months.
from 1 691 to
4 311  /m²
60% of transactions from the 2nd to the 8th deciles.
ApartmentsApartments
2 793  /m²
1-23-45-67-89-10
Reliability 6/10
Median price on the 13 transactions of the last 36 months.
from 2 354 to
3 013  /m²
60% of transactions from the 2nd to the 8th deciles.
DwellingsDwellings
2 789  /m²
1-23-45-67-89-10
Reliability 9/10
Median price on the 22 transactions of the last 6 months.
from 1 742 to
4 226  /m²
60% of transactions from the 2nd to the 8th deciles.
HousesEvolution of the price per m² of houses since...
1 year
-7.2%
2 years
-15%
3 years
+1.9%
4 years
+9.4%
5 years
+42%
6 years
+44%
7 years
+51%
8 years
+51%
9 years
+79%
10 years
+71%
11 years
+75%
The price per m² of houses has decreased by 15% since 2 years, but it has increased by 79% in 9 years.

Yearly evolution

Evolution of the median price per m²

Evolution of the median price per m² - 29 - Loctudy

Evolution of the number of transactions

Warning, last year incomplete. Projections made based on the proportions between semesters of the previous year at the departmental/national level and by type of property.

Evolution of the number of transactions - 29 - Loctudy

Yearly data

Descending order
Year
Houses
house
transactions
Houses
house
Price per m²
Apartments
apt.
transactions
Apartments
apt.
Price per m²
2025
21
2 785 
1
2 793 
2024
53
3 000 
5
2 846 
2023
74
3 268 
4
2 685 
2022
88
2 732 
7
2 328 
2021
99
2 545 
11
1 932 
2020
80
1 962 
9
1 824 
2019
94
1 931 
5
1 222 
2018
77
1 849 
11
1 862 
2017
93
1 845 
11
1 545 
2016
67
1 552 
5
1 383 
2015
61
1 627 
5
1 288 
2014
50
1 591 
5
1 857 

Analysis

Structure of prices per m²

Values of price percentiles per m² over the periods used for the estimated price of each type of property.

Structure of transaction amounts

Values of transaction amounts percentiles over the periods used for the estimated price of each type of property.

Transaction amounts and prices per m² by percentile

Ascending order
Percentile
Houses
house
Price per m²
Houses
house
Transaction amount
Apartments
apt.
Price per m²
Apartments
apt.
Transaction amount
10th percentile
1 279 
110 K
2 239 
84 000 
20th percentile
1 691 
160 K
2 354 
98 800 
30th percentile
2 051 
220 K
2 589 
115 K
40th percentile
2 500 
289 K
2 748 
121 K
50th percentile
2 785 
300 K
2 793 
135 K
60th percentile
3 000 
373 K
2 862 
148 K
70th percentile
3 518 
380 K
2 956 
155 K
80th percentile
4 311 
453 K
3 013 
166 K
90th percentile
5 000 
570 K
3 446 
172 K

National and departmental comparison

Evolution of the median price per m² of houses

Evolution of the median price per m² of apartments

Quarterly evolution

Evolution of the median price per m²

Evolution of the number of transactions

Quarterly data

Descending order
Quarter
Houses
house
transactions
Houses
house
Price per m²
Apartments
apt.
transactions
Apartments
apt.
Price per m²
2025 Q2
2
2 795 
0
--- 
2025 Q1
19
2 785 
1
2 793 
2024 Q4
13
3 499 
1
3 018 
2024 Q3
14
2 558 
2
2 792 
2024 Q2
7
3 214 
1
2 924 
2024 Q1
19
3 060 
1
2 212 
2023 Q4
29
2 826 
0
--- 
2023 Q3
18
3 696 
1
2 346 
2023 Q2
11
3 409 
2
2 987 
2023 Q1
16
3 310 
1
3 005 
2022 Q4
32
2 978 
3
2 750 
2022 Q3
15
3 611 
0
--- 
2022 Q2
23
2 663 
2
2 472 
2022 Q1
18
2 552 
2
1 701 
2021 Q4
27
2 495 
6
1 714 
2021 Q3
21
2 500 
0
--- 
2021 Q2
23
2 772 
3
2 054 
2021 Q1
28
2 391 
2
1 742 
2020 Q4
29
1 852 
2
2 112 
2020 Q3
14
1 978 
1
1 824 
2020 Q2
18
1 979 
3
2 211 
2020 Q1
19
2 123 
3
1 690 
2019 Q4
25
2 021 
2
1 066 
2019 Q3
23
2 169 
1
1 946 
2019 Q2
28
1 608 
1
2 286 
2019 Q1
18
1 738 
1
1 125 
2018 Q4
19
1 913 
7
1 862 
2018 Q3
17
2 037 
3
1 739 
2018 Q2
23
1 783 
0
--- 
2018 Q1
18
1 836 
1
2 237 
2017 Q4
22
1 952 
4
1 464 
2017 Q3
20
1 988 
3
1 286 
2017 Q2
22
1 712 
3
1 545 
2017 Q1
29
1 500 
1
1 915 
2016 Q4
26
1 764 
1
1 981 
2016 Q3
14
1 354 
2
1 060 
2016 Q2
10
1 730 
0
--- 
2016 Q1
17
1 549 
2
1 683 
2015 Q4
14
1 419 
1
2 358 
2015 Q3
22
1 790 
2
1 119 
2015 Q2
16
1 554 
1
1 446 
2015 Q1
9
1 733 
1
893 
2014 Q4
11
1 748 
1
1 783 
2014 Q3
15
1 238 
3
2 000 
2014 Q2
16
1 549 
0
--- 
2014 Q1
8
1 462 
1
1 857 

Overview of the latest real estate transactions

The following list is an anonymized overview of the latest transactions. For more details and to find all transactions, please use the map to view transactions by plot or the transaction search page for a search by criteria.

2025-05-20
17 300 
Sale
Land
855 m2
-Prés
Land
2515 m2
-Terres
Land
3550 m2
-Prés
2025-04-25
90 649 
Sale
Land
317 m2
-Terrains à bâtir
Land
183 m2
-Terrains à bâtir
2025-04-18
288 850 
4 311  /m²(67 m²)
Sale
Houses
House
4 rooms
67 m2
1 outbuilding
Land
276 m2
-Sols
Land
151 m2
-Sols
2025-04-09
110 000 
1 279  /m²(86 m²)
Sale
Houses
House
3 rooms
86 m2
Land
322 m2
-Sols
2025-03-31
1 646 585 
11 051  /m²(149 m²)
Sale
Houses
House
5 rooms
149 m2
1 outbuilding
Land
935 m2
-Sols
2025-03-22
2 000 
Sale
Land
3365 m2
-Terres
2025-03-15
48 000 
Sale
Land
1448 m2
-Terres
Land
9965 m2
-Futaies feuillues
Land
34955 m2
-Terres
Land
22450 m2
-Terres
Land
28077 m2
-Terres
2025-03-13
100 000 
1 000  /m²(100 m²)
Sale
Land
3 m2
-Sols
Houses
House
3 rooms
100 m2
Land
131 m2
-Sols
2025-03-11
230 336 
1 404  /m²(164 m²)
Sale
Houses
House
5 rooms
164 m2
Land
1000 m2
-Sols
2025-03-11
160 000 
2 051  /m²(78 m²)
Sale
Houses
House
4 rooms
78 m2
1 outbuilding
Land
255 m2
-Sols
2025-03-07
140 390 
1 691  /m²(83 m²)
Sale
Houses
House
3 rooms
83 m2
Land
836 m2
-Sols
2025-03-05
21 300 
Sale
Land
213 m2
-Terres
2025-02-26
300 000 
3 000  /m²(100 m²)
Sale
Houses
House
4 rooms
100 m2
1 outbuilding
Land
168 m2
-Sols
Land
24 m2
-Sols
2025-02-25
570 000 
4 750  /m²(120 m²)
Sale
Houses
House
5 rooms
120 m2
1 outbuilding
Land
820 m2
-Sols
Land
538 m2
-Terres
2025-02-18
373 000 
3 885  /m²(96 m²)
Sale
Houses
House
4 rooms
96 m2
Land
680 m2
-Sols
2025-02-15
287 000 
2 174  /m²(132 m²)
Sale
Houses
House
5 rooms
132 m2
2 outbuildings
Land
1870 m2
-Terrains d'agrément
Land
1000 m2
-Sols
Commercial property
Land
560 m2
-Terres
Land
110 m2
-Terres
2025-02-12
1 285 000 
5 181  /m²(248 m²)
Sale
Houses
House
6 rooms
248 m2
1 outbuilding
Land
1011 m2
-Terrains d'agrément
Land
700 m2
-Sols
2025-02-07
380 000 
5 000  /m²(76 m²)
Sale
Houses
House
5 rooms
76 m2
2 outbuildings
Land
608 m2
-Sols
2025-02-01
110 000 
Sale
Land
1190 m2
-Terres
Land
132 m2
-Sols
2025-01-31
452 595 
2 446  /m²(185 m²)
Sale
Houses
House
6 rooms
185 m2
Land
700 m2
-Sols
Land
582 m2
-Jardins
1635 transactions listed in the municipality

Finistère (29)

Most expensive cities

City
name
Descending orderHouses
house
Price per m²
3 989 
3 766 
3 461 
3 428 
3 146 
3 102 
3 044 
2 965 
City
name
Descending orderApartments
apt.
Price per m²
4 592 
4 260 
4 097 
3 933 
3 778 
3 210 
3 200 
3 066 

Least expensive cities

City
name
Ascending orderHouses
house
Price per m²
750 
792 
793 
830 
878 
889 
934 
935 
943 
City
name
Ascending orderApartments
apt.
Price per m²
200 
232 
312 
320 
339 
365 
388 
399 
415