emooki
HomePrice mapTransactions
🇬🇧 English🇫🇷 Français🇩🇪 Deutsch🇪🇸 Español🇮🇹 Italiano

Real estate price map


Real estate price map in the municipality of Plougasnou, choose a section to see transactions by parcel.

Finistère (29)

Plougasnou - Real estate price m²

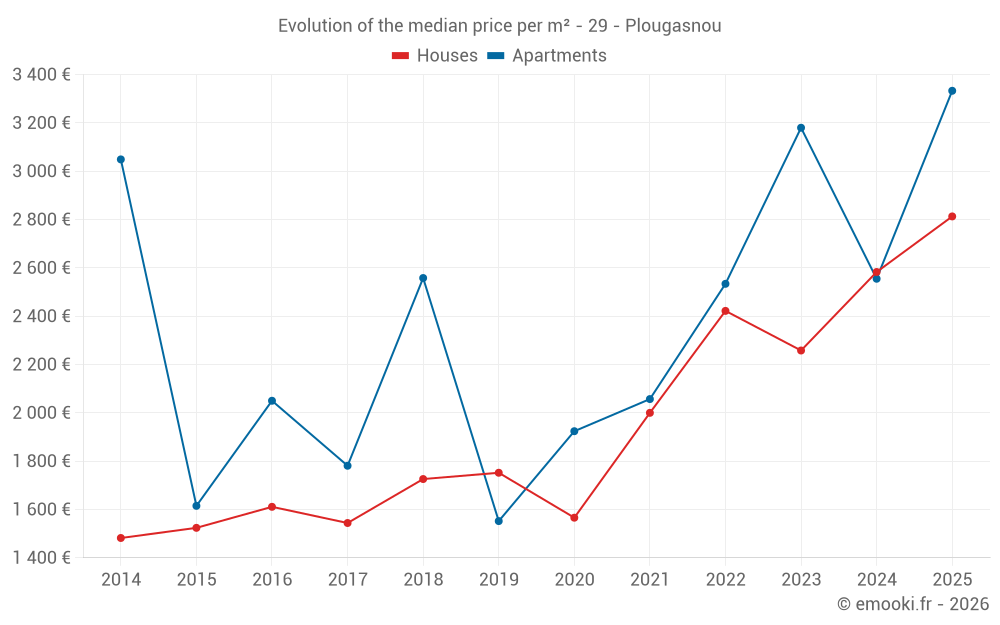
Median price of real estate
in the municipality of Plougasnou

HousesHouses
2 849  /m²
1-23-45-67-89-10
Reliability 8/10
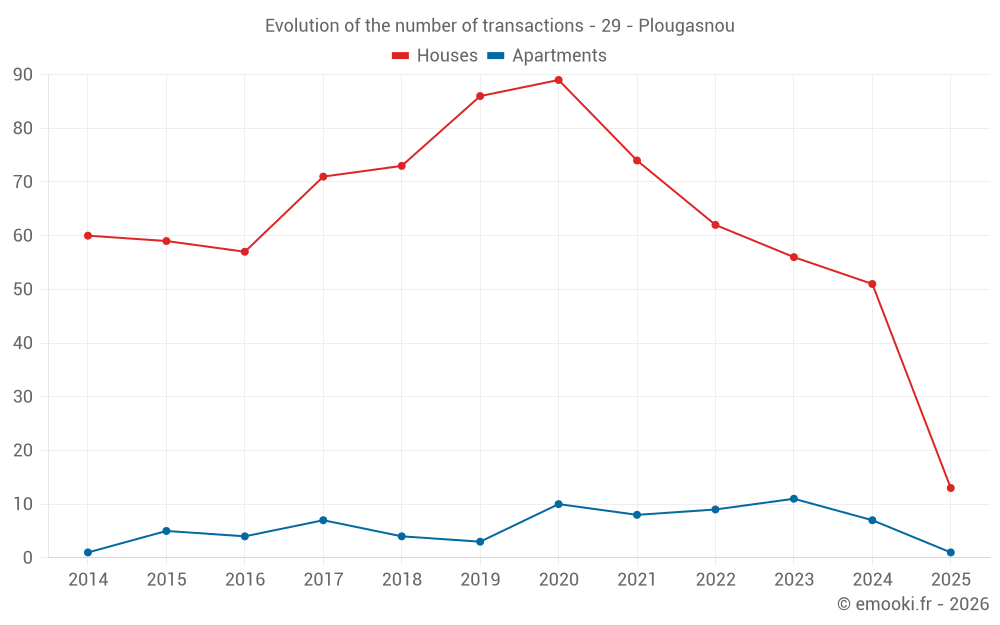
Median price on the 45 transactions of the last 12 months.
from 1 502 to
3 782  /m²
60% of transactions from the 2nd to the 8th deciles.
ApartmentsApartments
2 772  /m²
1-23-45-67-89-10
Reliability 6/10
Median price on the 23 transactions of the last 36 months.
from 2 198 to
3 541  /m²
60% of transactions from the 2nd to the 8th deciles.
DwellingsDwellings
2 831  /m²
1-23-45-67-89-10
Reliability 8/10
Median price on the 52 transactions of the last 12 months.
from 1 917 to
3 777  /m²
60% of transactions from the 2nd to the 8th deciles.
HousesEvolution of the price per m² of houses since...
1 year
+8.9%
2 years
+25%
3 years
+16%
4 years
+41%
5 years
+80%
6 years
+61%
7 years
+63%
8 years
+82%
9 years
+75%
10 years
+85%
11 years
+90%

Yearly evolution

Evolution of the median price per m²

Evolution of the median price per m² - 29 - Plougasnou

Evolution of the number of transactions

Warning, last year incomplete. Projections made based on the proportions between semesters of the previous year at the departmental/national level and by type of property.

Evolution of the number of transactions - 29 - Plougasnou

Yearly data

Descending order
Year
Houses
house
transactions
Houses
house
Price per m²
Apartments
apt.
transactions
Apartments
apt.
Price per m²
2025
13
2 813 
1
3 333 
2024
51
2 583 
7
2 555 
2023
56
2 258 
11
3 180 
2022
62
2 422 
9
2 534 
2021
74
2 000 
8
2 057 
2020
89
1 566 
10
1 924 
2019
86
1 752 
3
1 552 
2018
73
1 726 
4
2 558 
2017
71
1 544 
7
1 781 
2016
57
1 611 
4
2 050 
2015
59
1 524 
5
1 615 
2014
60
1 482 
1
3 049 

Analysis

Structure of prices per m²

Values of price percentiles per m² over the periods used for the estimated price of each type of property.

Structure of transaction amounts

Values of transaction amounts percentiles over the periods used for the estimated price of each type of property.

Transaction amounts and prices per m² by percentile

Ascending order
Percentile
Houses
house
Price per m²
Houses
house
Transaction amount
Apartments
apt.
Price per m²
Apartments
apt.
Transaction amount
10th percentile
1 090 
125 K
2 101 
77 803 
20th percentile
1 502 
148 K
2 198 
89 560 
30th percentile
2 038 
183 K
2 387 
108 K
40th percentile
2 467 
219 K
2 551 
116 K
50th percentile
2 849 
247 K
2 772 
121 K
60th percentile
3 035 
262 K
2 970 
136 K
70th percentile
3 630 
285 K
3 341 
148 K
80th percentile
3 782 
359 K
3 541 
161 K
90th percentile
4 130 
546 K
4 099 
264 K

National and departmental comparison

Evolution of the median price per m² of houses

Evolution of the median price per m² of apartments

Quarterly evolution

Evolution of the median price per m²

Evolution of the number of transactions

Quarterly data

Descending order
Quarter
Houses
house
transactions
Houses
house
Price per m²
Apartments
apt.
transactions
Apartments
apt.
Price per m²
2025 Q2
3
2 813 
0
--- 
2025 Q1
10
2 790 
1
3 333 
2024 Q4
19
2 583 
4
2 664 
2024 Q3
13
2 917 
2
2 870 
2024 Q2
6
2 666 
0
--- 
2024 Q1
13
2 222 
1
727 
2023 Q4
15
2 273 
0
--- 
2023 Q3
17
2 667 
5
3 353 
2023 Q2
10
1 864 
4
3 465 
2023 Q1
14
2 388 
2
2 358 
2022 Q4
16
2 578 
2
2 503 
2022 Q3
17
2 220 
2
2 340 
2022 Q2
16
2 394 
3
2 857 
2022 Q1
13
2 438 
2
2 067 
2021 Q4
11
2 361 
3
1 951 
2021 Q3
21
1 923 
3
2 140 
2021 Q2
20
1 938 
2
1 719 
2021 Q1
22
2 177 
0
--- 
2020 Q4
34
1 977 
2
2 449 
2020 Q3
25
1 593 
4
1 636 
2020 Q2
15
1 301 
3
2 000 
2020 Q1
15
1 468 
1
1 811 
2019 Q4
26
1 884 
2
1 448 
2019 Q3
22
1 534 
0
--- 
2019 Q2
23
1 882 
1
1 552 
2019 Q1
15
1 538 
0
--- 
2018 Q4
17
1 842 
2
2 558 
2018 Q3
17
1 488 
1
840 
2018 Q2
14
1 316 
0
--- 
2018 Q1
25
1 769 
1
3 355 
2017 Q4
23
1 748 
2
1 962 
2017 Q3
8
1 478 
0
--- 
2017 Q2
19
1 654 
3
1 781 
2017 Q1
21
1 375 
2
906 
2016 Q4
16
1 436 
3
2 000 
2016 Q3
10
1 340 
0
--- 
2016 Q2
15
1 867 
1
2 099 
2016 Q1
16
1 526 
0
--- 
2015 Q4
24
1 854 
0
--- 
2015 Q3
11
1 040 
2
2 282 
2015 Q2
15
1 398 
1
1 467 
2015 Q1
9
1 579 
2
1 283 
2014 Q4
19
1 500 
1
3 049 
2014 Q3
15
1 496 
0
--- 
2014 Q2
15
1 477 
0
--- 
2014 Q1
11
1 364 
0
--- 

Overview of the latest real estate transactions

The following list is an anonymized overview of the latest transactions. For more details and to find all transactions, please use the map to view transactions by plot or the transaction search page for a search by criteria.

2025-05-20
180 000 
2 813  /m²(64 m²)
Sale
Houses
House
3 rooms
64 m2
Land
606 m2
-Sols
2025-05-12
217 550 
2 417  /m²(90 m²)
Sale
Houses
House
3 rooms
90 m2
Land
287 m2
-Sols
Land
342 m2
-Sols
Land
199 m2
-Jardins
Land
544 m2
-Jardins
2025-04-25
68 500 
Sale
Land
513 m2
-Terrains à bâtir
Land
212 m2
-Sols
2025-04-04
559 000 
3 727  /m²(150 m²)
Sale
Houses
House
6 rooms
150 m2
Land
500 m2
-Sols
Land
736 m2
-Terrains d'agrément
Land
45 m2
-Sols
2025-03-31
40 470 
Sale
Land
426 m2
-Terrains à bâtir
2025-03-27
228 000 
3 677  /m²(62 m²)
Sale
Houses
House
4 rooms
62 m2
1 outbuilding
Land
647 m2
-Terres
Land
500 m2
-Sols
2025-03-19
550 000 
4 231  /m²(130 m²)
Sale
Houses
House
3 rooms
130 m2
2 outbuildings
Land
2980 m2
-Sols
Land
9526 m2
-Terrains d'agrément
2025-03-06
285 000 
2 714  /m²(105 m²)
Sale
Houses
House
4 rooms
105 m2
1 outbuilding
Land
578 m2
-Sols
2025-03-01
80 000 
Sale
Land
2927 m2
-Terres
Land
1393 m2
-Sols
2025-02-27
127 000 
Sale
2025-02-27
325 400 
1 914  /m²(170 m²)
Sale
Houses
House
7 rooms
170 m2
Land
2190 m2
-Terrains d'agrément
Land
500 m2
-Sols
2025-02-24
66 000 
Sale
Land
523 m2
-Terrains à bâtir
Land
251 m2
-Terrains à bâtir
2025-02-21
226 600 
3 777  /m²(60 m²)
Sale
Houses
House
2 rooms
60 m2
1 outbuilding
Land
286 m2
-Sols
2025-02-15
100 000 
725  /m²(138 m²)
Sale
Houses
House
1 room
38 m2
Land
36 m2
-Sols
Houses
House
5 rooms
100 m2
Land
92 m2
-Sols
Land
110 m2
-Sols
Land
23 m2
-Sols
Land
929 m2
-Sols
Land
1360 m2
-Terres
Land
59 m2
-Sols
Land
102 m2
-Sols
Land
339 m2
-Terres
Land
48 m2
-Terres
2025-02-14
1 
Sale
Land
9 m2
-Sols
Land
4 m2
-Sols
2025-02-14
220 000 
1 095  /m²(201 m²)
Sale
Houses
House
4 rooms
127 m2
2 outbuildings
Land
1048 m2
-Sols
Houses
House
2 rooms
74 m2
Land
326 m2
-Sols
Land
9 m2
-Sols
Land
4 m2
-Sols
Land
6 m2
-Sols
2025-02-03
320 900 
2 865  /m²(112 m²)
Sale
Houses
House
6 rooms
112 m2
1 outbuilding
Land
500 m2
-Sols
Land
549 m2
-Terrains d'agrément
2025-01-31
140 000 
2 188  /m²(64 m²)
Sale
Houses
House
2 rooms
64 m2
1 outbuilding
Land
185 m2
-Sols
2025-01-30
1 300 000 
465  /m²(2794 m²)
Sale
Commercial property
2444 m2
Commercial property
350 m2
Land
8683 m2
-Sols
Commercial property
Land
128 m2
-Sols
2025-01-28
42 275 
Sale
Land
445 m2
-Terrains à bâtir
1331 transactions listed in the municipality

Finistère (29)

Most expensive cities

City
name
Descending orderHouses
house
Price per m²
3 989 
3 766 
3 461 
3 428 
3 146 
3 102 
3 044 
2 965 
City
name
Descending orderApartments
apt.
Price per m²
4 592 
4 260 
4 097 
3 933 
3 778 
3 210 
3 200 
3 066 

Least expensive cities

City
name
Ascending orderHouses
house
Price per m²
750 
792 
793 
830 
878 
889 
934 
935 
943 
City
name
Ascending orderApartments
apt.
Price per m²
200 
232 
312 
320 
339 
365 
388 
399 
415