emooki
HomePrice mapTransactions
🇬🇧 English🇫🇷 Français🇩🇪 Deutsch🇪🇸 Español🇮🇹 Italiano

Real estate price map


Real estate price map in the municipality of Châteauneuf-du-Faou, choose a section to see transactions by parcel.

Finistère (29)
Châteauneuf-du-Faou

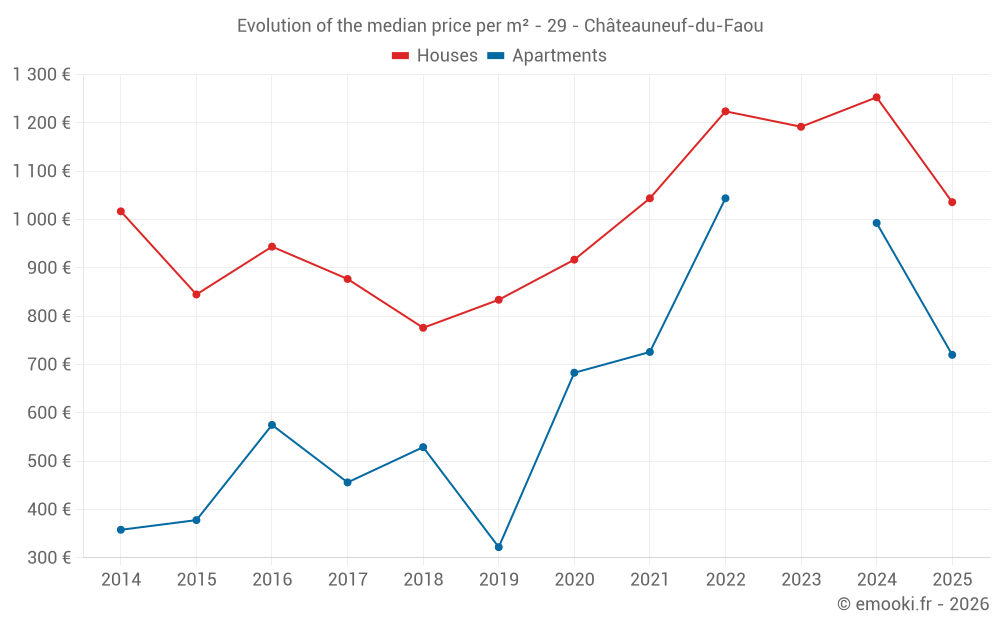
Median price of real estate
in the municipality of Châteauneuf-du-Faou

HousesHouses
1 036  /m²
1-23-45-67-89-10
Reliability 9/10
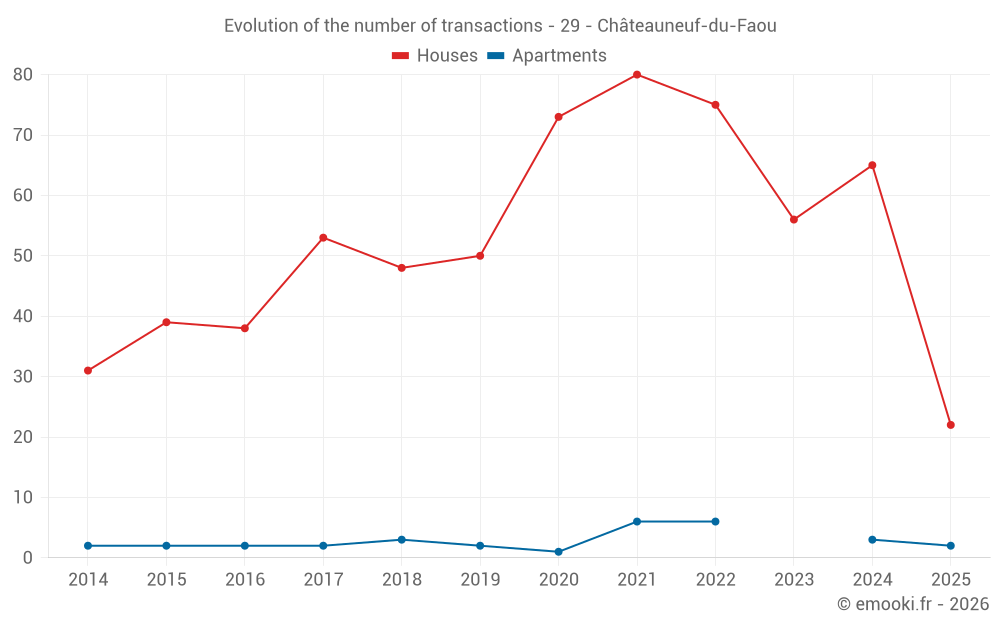
Median price on the 22 transactions of the last 6 months.
from 698 to
1 882  /m²
60% of transactions from the 2nd to the 8th deciles.
ApartmentsApartments
930  /m²
1-23-45-67-89-10
Reliability 5/10
Median price on the 14 transactions of the last 48 months.
from 671 to
1 195  /m²
60% of transactions from the 2nd to the 8th deciles.
DwellingsDwellings
945  /m²
1-23-45-67-89-10
Reliability 9/10
Median price on the 24 transactions of the last 6 months.
from 664 to
1 838  /m²
60% of transactions from the 2nd to the 8th deciles.
HousesEvolution of the price per m² of houses since...
1 year
-17%
2 years
-13%
3 years
-15%
4 years
-0.8%
5 years
+13%
6 years
+24%
7 years
+34%
8 years
+18%
9 years
+10%
10 years
+23%
11 years
+1.9%
The price per m² of houses has decreased by 17% since 1 year, but it has increased by 34% in 7 years.

Yearly evolution

Evolution of the median price per m²

Evolution of the number of transactions

Warning, last year incomplete. Projections made based on the proportions between semesters of the previous year at the departmental/national level and by type of property.

Yearly data

Descending order
Year
Houses
house
transactions
Houses
house
Price per m²
Apartments
apt.
transactions
Apartments
apt.
Price per m²
2025
22
1 036 
2
720 
2024
65
1 253 
3
993 
2023
56
1 192 
0
--- 
2022
75
1 224 
6
1 044 
2021
80
1 044 
6
726 
2020
73
917 
1
683 
2019
50
834 
2
322 
2018
48
776 
3
529 
2017
53
877 
2
456 
2016
38
944 
2
575 
2015
39
845 
2
378 
2014
31
1 017 
2
358 

Analysis

Structure of prices per m²

Values of price percentiles per m² over the periods used for the estimated price of each type of property.

Structure of transaction amounts

Values of transaction amounts percentiles over the periods used for the estimated price of each type of property.

Transaction amounts and prices per m² by percentile

Ascending order
Percentile
Houses
house
Price per m²
Houses
house
Transaction amount
Apartments
apt.
Price per m²
Apartments
apt.
Transaction amount
10th percentile
597 
50 000 
484 
37 900 
20th percentile
698 
50 900 
671 
41 500 
30th percentile
735 
60 000 
736 
44 750 
40th percentile
790 
66 400 
863 
49 420 
50th percentile
1 036 
75 500 
930 
74 550 
60th percentile
1 334 
87 400 
1 015 
98 800 
70th percentile
1 653 
120 K
1 032 
127 K
80th percentile
1 882 
149 K
1 195 
155 K
90th percentile
2 060 
222 K
1 393 
192 K

National and departmental comparison

Evolution of the median price per m² of houses

Evolution of the median price per m² of apartments

Quarterly evolution

Evolution of the median price per m²

Evolution of the number of transactions

Quarterly data

Descending order
Quarter
Houses
house
transactions
Houses
house
Price per m²
Apartments
apt.
transactions
Apartments
apt.
Price per m²
2025 Q2
6
988 
1
1 028 
2025 Q1
16
1 036 
1
413 
2024 Q4
17
1 157 
1
1 429 
2024 Q3
15
1 649 
0
--- 
2024 Q2
15
1 253 
1
993 
2024 Q1
18
968 
1
648 
2023 Q4
16
1 148 
0
--- 
2023 Q3
14
1 506 
0
--- 
2023 Q2
17
1 156 
0
--- 
2023 Q1
9
1 017 
0
--- 
2022 Q4
18
1 292 
1
862 
2022 Q3
18
1 152 
3
1 020 
2022 Q2
15
1 263 
2
1 390 
2022 Q1
24
1 239 
0
--- 
2021 Q4
19
1 241 
1
741 
2021 Q3
13
1 136 
2
776 
2021 Q2
35
1 043 
3
710 
2021 Q1
13
1 000 
0
--- 
2020 Q4
21
1 000 
0
--- 
2020 Q3
25
675 
0
--- 
2020 Q2
10
1 094 
0
--- 
2020 Q1
17
893 
1
683 
2019 Q4
19
1 038 
1
402 
2019 Q3
11
790 
0
--- 
2019 Q2
9
723 
1
243 
2019 Q1
11
854 
0
--- 
2018 Q4
10
692 
1
529 
2018 Q3
18
860 
1
453 
2018 Q2
10
962 
1
1 533 
2018 Q1
10
728 
0
--- 
2017 Q4
16
890 
0
--- 
2017 Q3
14
830 
1
578 
2017 Q2
10
818 
0
--- 
2017 Q1
13
893 
1
333 
2016 Q4
9
1 028 
0
--- 
2016 Q3
10
830 
0
--- 
2016 Q2
12
990 
1
645 
2016 Q1
7
935 
1
505 
2015 Q4
15
821 
1
350 
2015 Q3
10
938 
1
406 
2015 Q2
4
834 
0
--- 
2015 Q1
10
922 
0
--- 
2014 Q4
9
1 186 
0
--- 
2014 Q3
8
864 
1
551 
2014 Q2
3
1 007 
0
--- 
2014 Q1
11
1 134 
1
164 

Overview of the latest real estate transactions

The following list is an anonymized overview of the latest transactions. For more details and to find all transactions, please use the map to view transactions by plot or the transaction search page for a search by criteria.

2025-06-02
2 400 
Sale
Land
1592 m2
-Prés
Land
6002 m2
-Terres
2025-06-02
20 000 
196  /m²(102 m²)
Sale
Houses
House
4 rooms
102 m2
1 outbuilding
Land
846 m2
-Sols
Land
293 m2
-Sols
Land
648 m2
-Sols
Land
210 m2
-Terres
Land
442 m2
-Terres
Land
224 m2
-Sols
Land
425 m2
-Terres
Land
384 m2
-Sols
2025-05-20
20 000 
Sale
Land
5000 m2
-Prés
Land
2000 m2
-Sols
Land
23815 m2
-Terres
2025-04-29
60 000 
1 250  /m²(48 m²)
Sale
Houses
House
3 rooms
48 m2
Land
92 m2
-Sols
Land
160 m2
-Terres
Land
224 m2
-Terres
Land
858 m2
-Terres
2025-04-29
37 000 
1 028  /m²(36 m²)
Sale
Apartments
Apartment
2 rooms
36 m2
2025-04-24
50 000 
595  /m²(84 m²)
Sale
Houses
House
4 rooms
84 m2
Land
447 m2
-Sols
1 outbuilding
Land
500 m2
-Sols
Land
3037 m2
-Terres
Land
4 m2
-Terres
Land
407 m2
-Terres
2025-04-16
74 000 
725  /m²(102 m²)
Sale
Houses
House
5 rooms
102 m2
1 outbuilding
Land
406 m2
-Sols
2025-04-09
2 145 
Sale
Land
4289 m2
-Terres
2025-04-07
200 000 
2 174  /m²(92 m²)
Sale
Houses
House
3 rooms
92 m2
2 outbuildings
Land
2742 m2
-Jardins
Land
500 m2
-Sols
2025-04-07
60 000 
2 000  /m²(30 m²)
Sale
1 outbuilding
Land
1018 m2
-Sols
Houses
House
2 rooms
30 m2
Land
3983 m2
-Terres
Land
800 m2
-Sols
Land
1000 m2
-Jardins
Land
299 m2
-Landes
2025-04-02
12 000 
Sale
Land
4667 m2
-Taillis simples
Land
6000 m2
-Futaies résineuses
2025-03-27
10 000 
Sale
Land
3034 m2
-Sols
Land
2014 m2
-Terres
2025-03-27
40 000 
Sale
Land
3046 m2
-Taillis simples
Land
1461 m2
-Sols
Land
2095 m2
-Terres
Land
1028 m2
-Sols
2025-03-24
3 000 
Sale
Land
1607 m2
-Landes
Land
3213 m2
-Terres
Land
10278 m2
-Terres
Land
800 m2
-Taillis simples
Land
8323 m2
-Prés
2025-03-19
28 898 
Sale
1 outbuilding
Land
42 m2
-Sols
2025-03-18
152 300 
1 904  /m²(80 m²)
Sale
Houses
House
4 rooms
80 m2
1 outbuilding
Land
435 m2
-Sols
2025-03-17
91 000 
758  /m²(120 m²)
Sale
Houses
House
4 rooms
120 m2
Land
105 m2
-Sols
Land
11 m2
-Sols
Land
8 m2
-Sols
Land
456 m2
-Jardins
2025-03-14
82 000 
1 390  /m²(59 m²)
Sale
Houses
House
3 rooms
59 m2
1 outbuilding
Land
528 m2
-Sols
Land
13190 m2
-Terres
Land
414 m2
-Sols
Land
8701 m2
-Terres
2025-03-13
70 000 
833  /m²(84 m²)
Sale
Houses
House
5 rooms
84 m2
3 outbuildings
Land
115 m2
-Sols
Land
77 m2
-Sols
Land
48 m2
-Sols
Land
478 m2
-Terres
2025-03-07
500 
Sale
Land
8665 m2
-Prés
1161 transactions listed in the municipality

Finistère (29)

Most expensive cities

City
name
Descending orderHouses
house
Price per m²
3 989 
3 766 
3 461 
3 428 
3 146 
3 102 
3 044 
2 965 
City
name
Descending orderApartments
apt.
Price per m²
4 592 
4 260 
4 097 
3 933 
3 778 
3 210 
3 200 
3 066 

Least expensive cities

City
name
Ascending orderHouses
house
Price per m²
750 
792 
793 
830 
878 
889 
934 
935 
943 
City
name
Ascending orderApartments
apt.
Price per m²
200 
232 
312 
320 
339 
365 
388 
399 
415