Median price of real estate
in the municipality of Penmarch
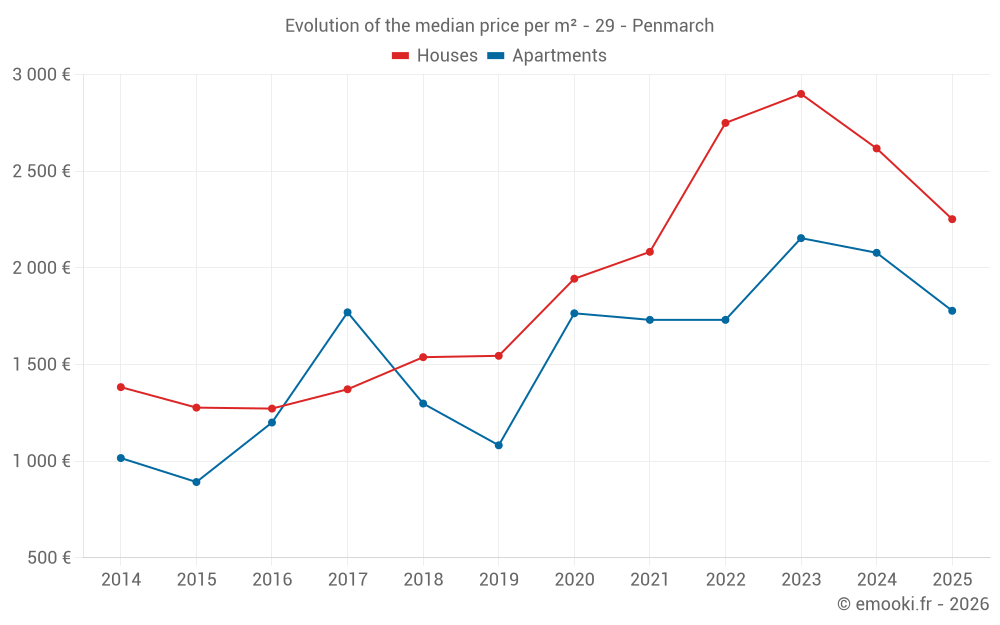
Houses
2 252 € /m²
Reliability 9/10
Median price on the 22 transactions of the last 6 months.
from 1 472 to
2 950 € /m²
2 950 € /m²
60% of transactions from the 2nd to the 8th deciles.
Apartments
2 036 € /m²
Reliability 7/10
Median price on the 21 transactions of the last 24 months.
from 1 588 to
2 955 € /m²
2 955 € /m²
60% of transactions from the 2nd to the 8th deciles.
Dwellings
2 156 € /m²
Reliability 9/10
Median price on the 23 transactions of the last 6 months.
from 1 504 to
2 900 € /m²
2 900 € /m²
60% of transactions from the 2nd to the 8th deciles.