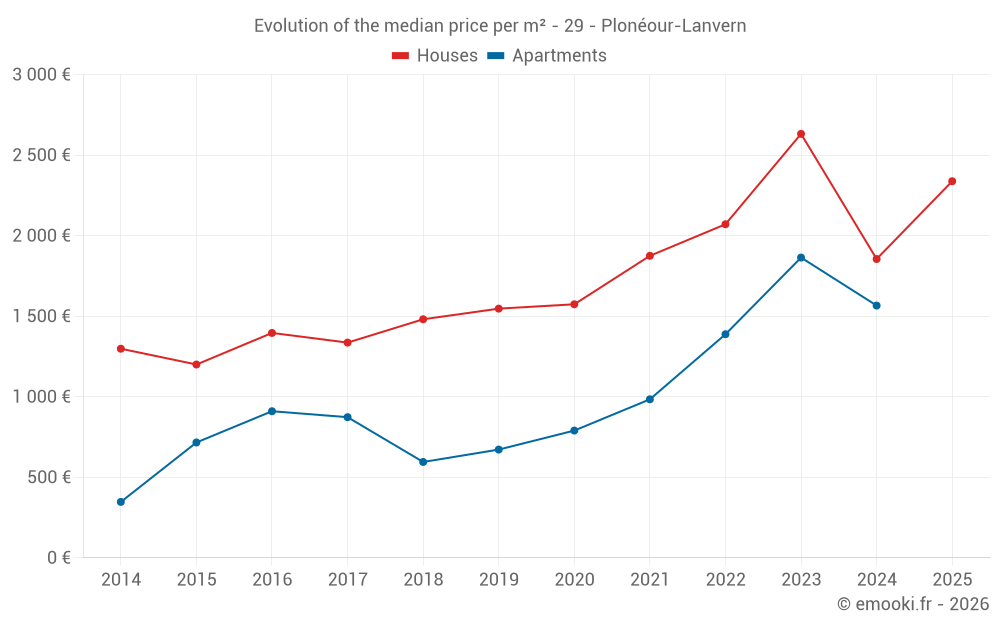
Median price of real estate
in the municipality of Plonéour-Lanvern
Houses
2 338 € /m²
Reliability 9/10
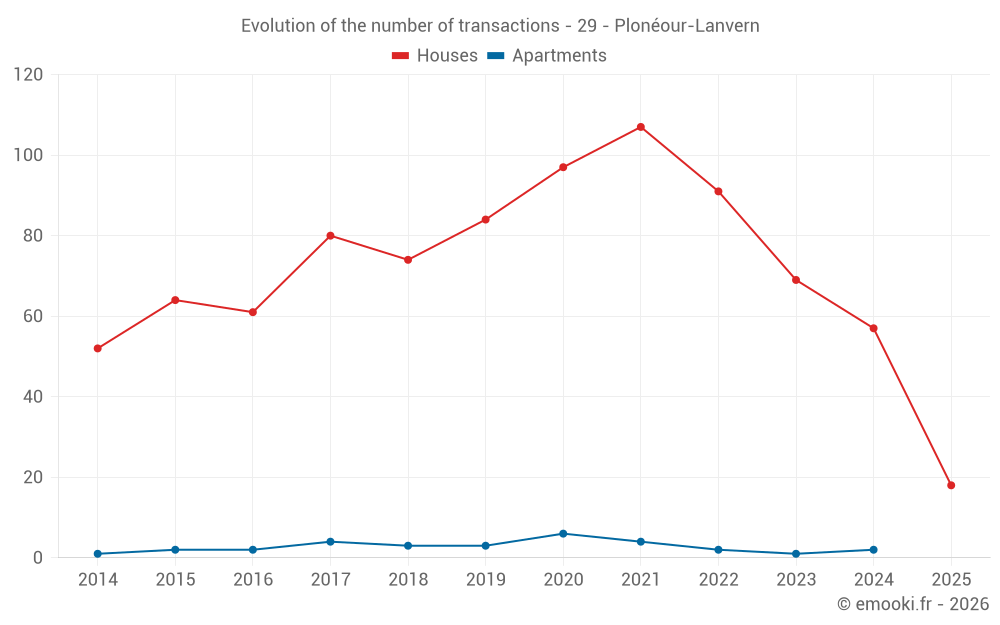
Median price on the 18 transactions of the last 6 months.
from 1 631 to
3 177 € /m²
3 177 € /m²
60% of transactions from the 2nd to the 8th deciles.
Apartments
1 290 € /m²
Reliability 4/10
Median price on the 12 transactions of the last 60 months.
from 792 to
1 582 € /m²
1 582 € /m²
60% of transactions from the 2nd to the 8th deciles.
Dwellings
2 338 € /m²
Reliability 9/10
Median price on the 18 transactions of the last 6 months.
from 1 631 to
3 177 € /m²
3 177 € /m²
60% of transactions from the 2nd to the 8th deciles.