emooki
HomePrice mapTransactions
🇬🇧 English🇫🇷 Français🇩🇪 Deutsch🇪🇸 Español🇮🇹 Italiano

Real estate price map


Real estate price map in the municipality of Châteaulin.

Finistère (29)
Châteaulin

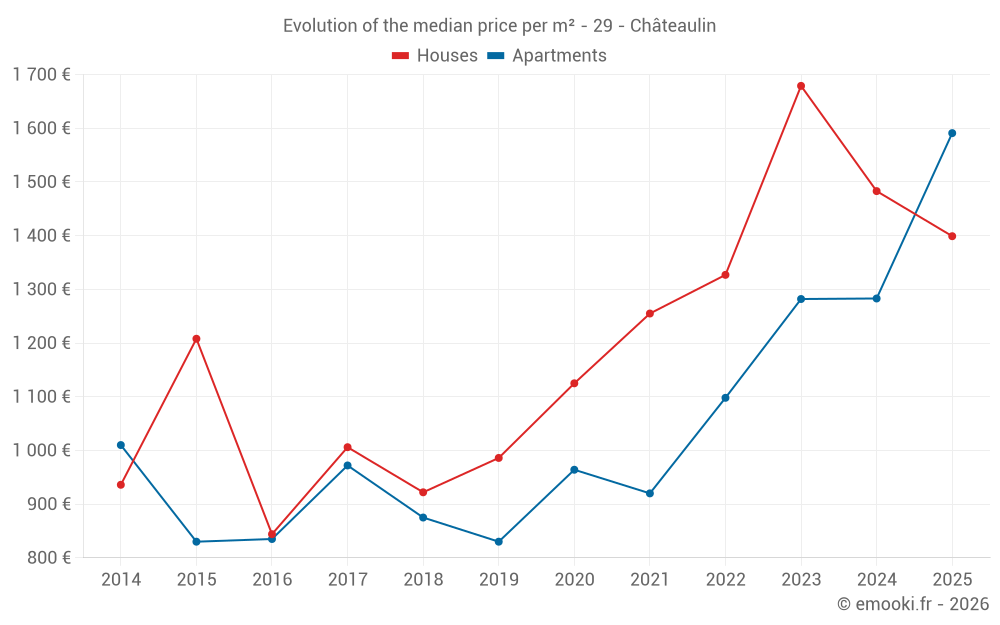
Median price of real estate
in the municipality of Châteaulin

HousesHouses
1 402  /m²
1-23-45-67-89-10
Reliability 8/10
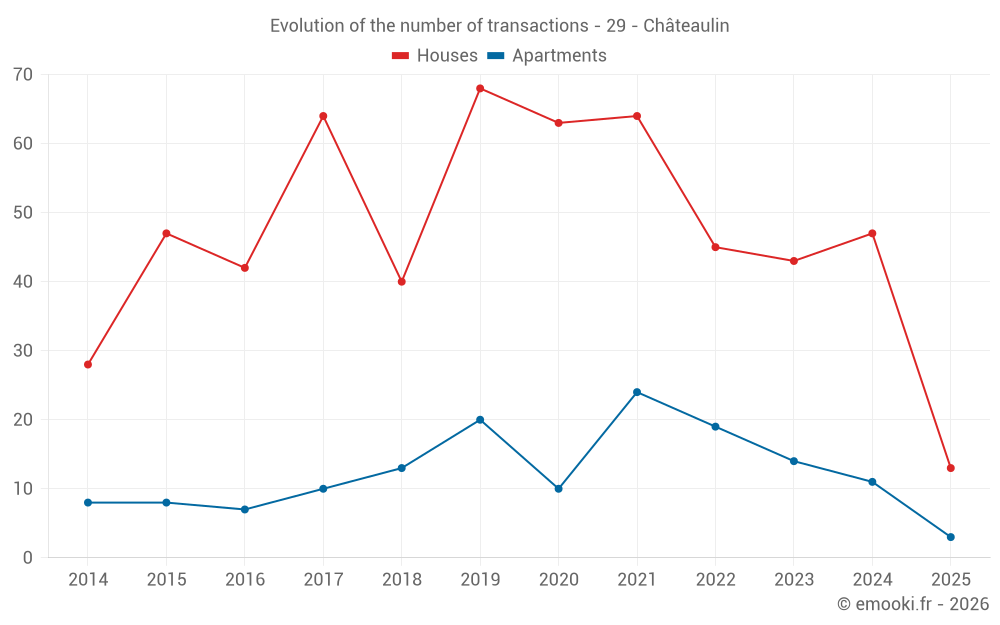
Median price on the 38 transactions of the last 12 months.
from 863 to
1 854  /m²
60% of transactions from the 2nd to the 8th deciles.
ApartmentsApartments
1 283  /m²
1-23-45-67-89-10
Reliability 7/10
Median price on the 19 transactions of the last 24 months.
from 1 034 to
1 587  /m²
60% of transactions from the 2nd to the 8th deciles.
DwellingsDwellings
1 404  /m²
1-23-45-67-89-10
Reliability 8/10
Median price on the 47 transactions of the last 12 months.
from 933 to
1 715  /m²
60% of transactions from the 2nd to the 8th deciles.
HousesEvolution of the price per m² of houses since...
1 year
-5.7%
2 years
-17%
3 years
+5.4%
4 years
+11%
5 years
+24%
6 years
+42%
7 years
+52%
8 years
+39%
9 years
+66%
10 years
+16%
11 years
+49%
ApartmentsEvolution of the price per m² of apartments since...
1 year
--
2 years
--
3 years
--
4 years
--
5 years
--
6 years
--
7 years
--
8 years
--
9 years
--
10 years
--
11 years
--

Yearly evolution

Evolution of the median price per m²

Evolution of the number of transactions

Warning, last year incomplete. Projections made based on the proportions between semesters of the previous year at the departmental/national level and by type of property.

Yearly data

Descending order
Year
Houses
house
transactions
Houses
house
Price per m²
Apartments
apt.
transactions
Apartments
apt.
Price per m²
2025
13
1 399 
3
1 591 
2024
47
1 483 
11
1 283 
2023
43
1 679 
14
1 282 
2022
45
1 327 
19
1 098 
2021
64
1 255 
24
920 
2020
63
1 125 
10
964 
2019
68
986 
20
830 
2018
40
922 
13
875 
2017
64
1 006 
10
972 
2016
42
844 
7
835 
2015
47
1 208 
8
830 
2014
28
936 
8
1 010 

Analysis

Structure of prices per m²

Values of price percentiles per m² over the periods used for the estimated price of each type of property.

Structure of transaction amounts

Values of transaction amounts percentiles over the periods used for the estimated price of each type of property.

Transaction amounts and prices per m² by percentile

Ascending order
Percentile
Houses
house
Price per m²
Houses
house
Transaction amount
Apartments
apt.
Price per m²
Apartments
apt.
Transaction amount
10th percentile
733 
70 280 
784 
33 800 
20th percentile
863 
74 400 
1 034 
46 680 
30th percentile
1 111 
92 640 
1 158 
59 440 
40th percentile
1 277 
105 K
1 263 
70 000 
50th percentile
1 402 
118 K
1 283 
80 000 
60th percentile
1 554 
133 K
1 369 
104 K
70th percentile
1 681 
162 K
1 444 
126 K
80th percentile
1 854 
183 K
1 587 
140 K
90th percentile
2 083 
249 K
1 743 
168 K

National and departmental comparison

Evolution of the median price per m² of houses

Evolution of the median price per m² of apartments

Quarterly evolution

Evolution of the median price per m²

Evolution of the number of transactions

Quarterly data

Descending order
Quarter
Houses
house
transactions
Houses
house
Price per m²
Apartments
apt.
transactions
Apartments
apt.
Price per m²
2025 Q2
4
1 982 
0
--- 
2025 Q1
9
1 051 
3
1 591 
2024 Q4
13
1 404 
3
1 585 
2024 Q3
12
1 486 
3
1 258 
2024 Q2
9
1 545 
2
765 
2024 Q1
13
1 568 
3
1 390 
2023 Q4
8
1 611 
3
1 233 
2023 Q3
8
1 630 
2
1 028 
2023 Q2
15
2 153 
6
1 382 
2023 Q1
12
1 700 
3
1 331 
2022 Q4
6
1 294 
5
1 556 
2022 Q3
20
1 570 
6
972 
2022 Q2
7
1 111 
4
1 112 
2022 Q1
12
1 288 
4
1 026 
2021 Q4
19
1 167 
8
971 
2021 Q3
12
1 466 
4
1 072 
2021 Q2
18
1 246 
4
944 
2021 Q1
15
1 353 
8
858 
2020 Q4
19
1 087 
3
949 
2020 Q3
15
841 
4
1 109 
2020 Q2
17
1 151 
2
790 
2020 Q1
12
1 292 
1
1 222 
2019 Q4
12
1 136 
6
936 
2019 Q3
25
988 
6
689 
2019 Q2
12
918 
4
890 
2019 Q1
19
944 
4
890 
2018 Q4
11
974 
5
885 
2018 Q3
10
910 
0
--- 
2018 Q2
11
857 
2
779 
2018 Q1
8
964 
6
430 
2017 Q4
8
1 244 
3
1 311 
2017 Q3
20
1 030 
2
916 
2017 Q2
19
974 
1
1 140 
2017 Q1
17
1 000 
4
930 
2016 Q4
11
1 043 
0
--- 
2016 Q3
16
840 
2
804 
2016 Q2
9
662 
5
865 
2016 Q1
6
834 
0
--- 
2015 Q4
15
1 244 
1
1 186 
2015 Q3
22
1 070 
2
427 
2015 Q2
5
1 274 
4
830 
2015 Q1
5
938 
1
1 375 
2014 Q4
4
534 
2
1 092 
2014 Q3
11
914 
2
891 
2014 Q2
6
1 298 
3
1 250 
2014 Q1
7
1 250 
1
1 078 

Finistère (29)

Most expensive cities

City
name
Descending orderHouses
house
Price per m²
3 989 
3 766 
3 461 
3 428 
3 146 
3 102 
3 044 
2 965 
City
name
Descending orderApartments
apt.
Price per m²
4 592 
4 260 
4 097 
3 933 
3 778 
3 210 
3 200 
3 066 

Least expensive cities

City
name
Ascending orderHouses
house
Price per m²
750 
792 
793 
830 
878 
889 
934 
935 
943 
City
name
Ascending orderApartments
apt.
Price per m²
200 
232 
312 
320 
339 
365 
388 
399 
415