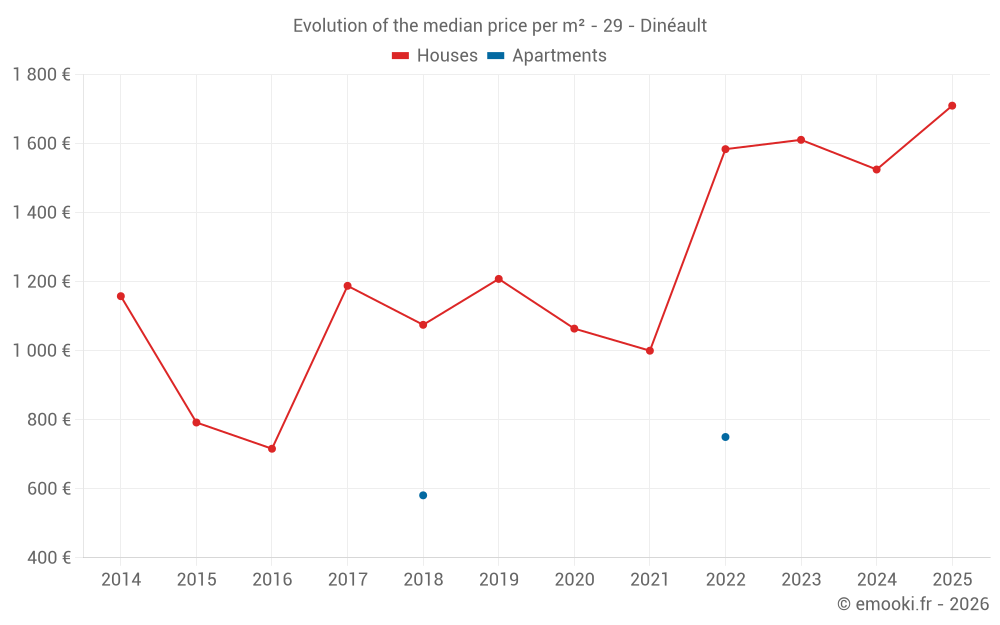
Median price of real estate
in the municipality of Dinéault
Houses
1 552 € /m²
Reliability 7/10
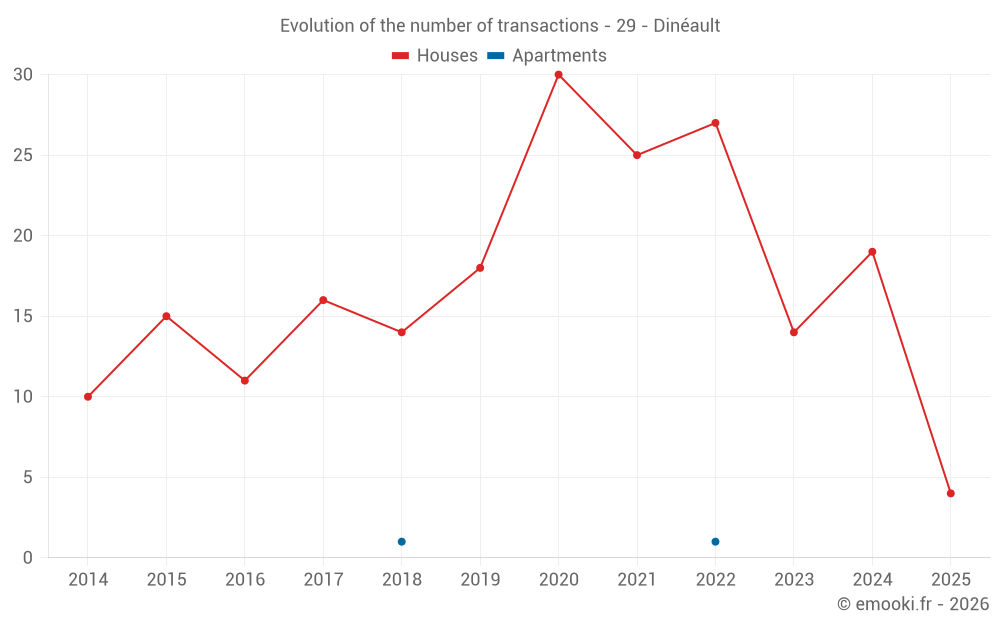
Median price on the 32 transactions of the last 24 months.
from 1 176 to
2 079 € /m²
2 079 € /m²
60% of transactions from the 2nd to the 8th deciles.
Apartments
666 € /m²
Reliability 1/10
Median price on the 2 transactions of the last 120 months.
Dwellings
1 552 € /m²
Reliability 7/10
Median price on the 32 transactions of the last 24 months.
from 1 176 to
2 079 € /m²
2 079 € /m²
60% of transactions from the 2nd to the 8th deciles.