emooki
HomePrice mapTransactions
🇬🇧 English🇫🇷 Français🇩🇪 Deutsch🇪🇸 Español🇮🇹 Italiano

Real estate price map


Real estate price map in the municipality of Quemigny-sur-Seine, choose a section to see transactions by parcel.

Côte-d'Or (21)

Quemigny-sur-Seine - Real estate price m²

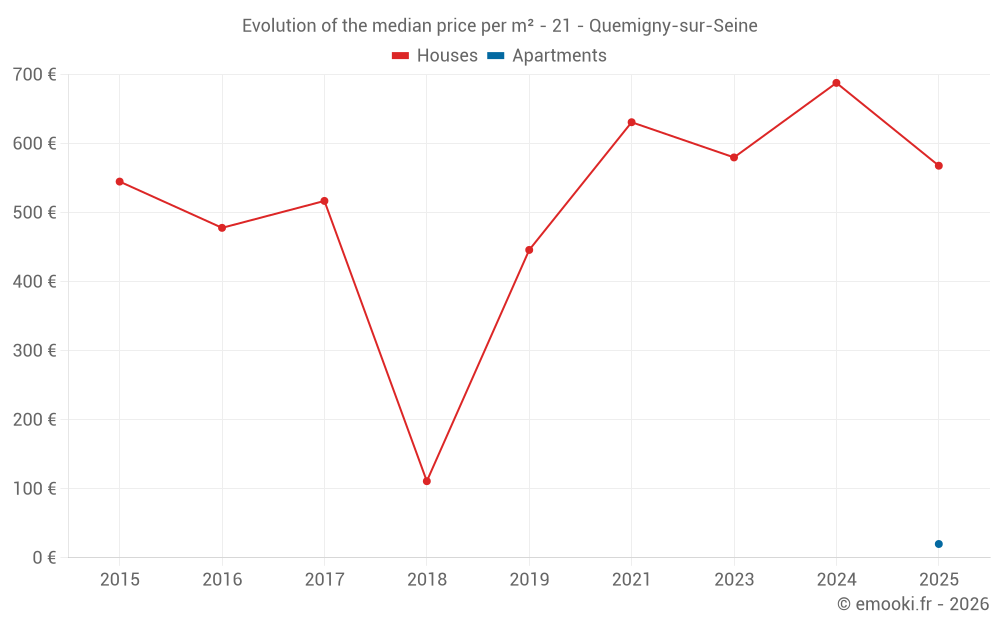
Median price of real estate
in the municipality of Quemigny-sur-Seine

HousesHouses
574  /m²
1-23-45-67-89-10
Reliability 5/10
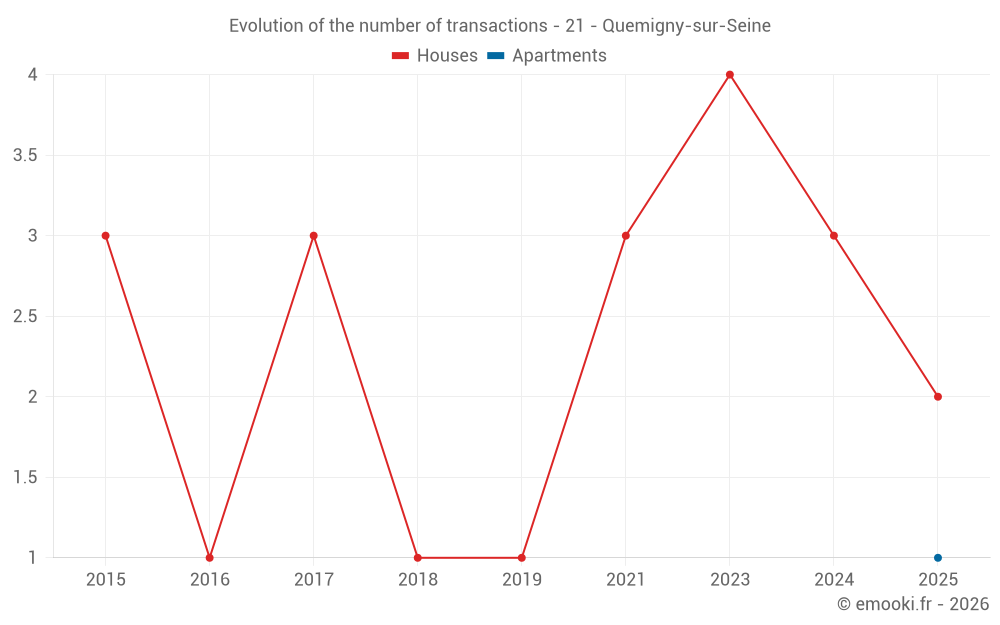
Median price on the 10 transactions of the last 48 months.
ApartmentsApartments
20  /m²
1-23-45-67-89-10
Reliability 1/10
Price of the unique transaction of the last 120 months.
DwellingsDwellings
459  /m²
1-23-45-67-89-10
Reliability 5/10
Median price on the 11 transactions of the last 48 months.
from 168 to
857  /m²
60% of transactions from the 2nd to the 8th deciles.

Yearly evolution

Evolution of the median price per m²

Evolution of the median price per m² - 21 - Quemigny-sur-Seine

Evolution of the number of transactions

Warning, last year incomplete. Projections made based on the proportions between semesters of the previous year at the departmental/national level and by type of property.

Evolution of the number of transactions - 21 - Quemigny-sur-Seine

Yearly data

Descending order
Year
Houses
house
transactions
Houses
house
Price per m²
Apartments
apt.
transactions
Apartments
apt.
Price per m²
2025
2
568 
1
20 
2024
3
688 
0
--- 
2023
4
580 
0
--- 
2022
0
--- 
0
--- 
2021
3
631 
0
--- 
2020
0
--- 
0
--- 
2019
1
446 
0
--- 
2018
1
111 
0
--- 
2017
3
517 
0
--- 
2016
1
478 
0
--- 
2015
3
545 
0
--- 
2014
0
--- 
0
--- 

Analysis

Structure of prices per m²

Values of price percentiles per m² over the periods used for the estimated price of each type of property.

Structure of transaction amounts

Values of transaction amounts percentiles over the periods used for the estimated price of each type of property.

Transaction amounts and prices per m² by percentile

Ascending order
Percentile
Houses
house
Price per m²
Houses
house
Transaction amount
Apartments
apt.
Price per m²
Apartments
apt.
Transaction amount
10th percentile
162 
24 500 
20 
3 000 
20th percentile
256 
37 000 
20 
3 000 
30th percentile
403 
40 000 
20 
3 000 
40th percentile
458 
47 800 
20 
3 000 
50th percentile
574 
53 270 
20 
3 000 
60th percentile
694 
54 924 
20 
3 000 
70th percentile
748 
61 950 
20 
3 000 
80th percentile
900 
74 400 
20 
3 000 
90th percentile
1 074 
85 650 
20 
3 000 

National and departmental comparison

Evolution of the median price per m² of houses

Evolution of the median price per m² of apartments

Quarterly evolution

Evolution of the median price per m²

Evolution of the number of transactions

Quarterly data

Descending order
Quarter
Houses
house
transactions
Houses
house
Price per m²
Apartments
apt.
transactions
Apartments
apt.
Price per m²
2025 Q2
0
--- 
1
20 
2025 Q1
2
568 
0
--- 
2024 Q2
3
688 
0
--- 
2023 Q4
1
702 
0
--- 
2023 Q3
1
456 
0
--- 
2023 Q1
2
782 
0
--- 
2021 Q4
1
111 
0
--- 
2021 Q2
1
631 
0
--- 
2021 Q1
1
915 
0
--- 
2019 Q1
1
446 
0
--- 
2018 Q4
1
111 
0
--- 
2017 Q3
1
517 
0
--- 
2017 Q2
1
472 
0
--- 
2017 Q1
1
611 
0
--- 
2016 Q4
1
478 
0
--- 
2015 Q3
2
888 
0
--- 
2015 Q1
1
545 
0
--- 

Overview of the latest real estate transactions

The following list is an anonymized overview of the latest transactions. For more details and to find all transactions, please use the map to view transactions by plot or the transaction search page for a search by criteria.

2025-05-07
3 000 
20  /m²(150 m²)
Sale
Apartments
Apartment
4 rooms
150 m2
1 outbuilding
Land
229 m2
-Sols
Land
223 m2
-Landes
/Patis
2025-03-31
25 000 
278  /m²(90 m²)
Sale
Houses
House
3 rooms
90 m2
2 outbuildings
Land
418 m2
-Sols
Land
95 m2
-Sols
Land
638 m2
-Jardins
2025-03-28
78 000 
857  /m²(91 m²)
Sale
Houses
House
2 rooms
91 m2
1 outbuilding
Land
602 m2
-Sols
Land
152 m2
-Jardins
2024-10-01
5 000 
Sale
Land
547 m2
-Jardins
2024-06-28
53 540 
1 071  /m²(50 m²)
Sale
Houses
House
3 rooms
50 m2
Land
138 m2
-Sols
Land
14 m2
-Sols
Land
114 m2
-Sols
2024-06-14
53 000 
688  /m²(77 m²)
Sale
Houses
House
3 rooms
77 m2
Land
48 m2
-Sols
Land
40 m2
-Sols
Land
45 m2
-Sols
2024-04-11
40 000 
168  /m²(238 m²)
Sale
Houses
House
6 rooms
169 m2
Houses
House
3 rooms
69 m2
2 outbuildings
Land
822 m2
-Sols
Land
71 m2
-Sols
Land
550 m2
-Jardins
Land
15 m2
-Sols
2024-02-23
8 000 
Exchange
Land
49980 m2
-Terres
2024-02-16
18 420 
Sale
Land
43400 m2
-Terres
Land
18000 m2
-Landes
2024-01-26
2 800 
Sale
Land
1640 m2
-Prés
2024-01-08
3 000 
Sale
Land
2710 m2
-Terres
2023-11-28
40 000 
702  /m²(57 m²)
Sale
Houses
House
3 rooms
57 m2
1 outbuilding
Land
590 m2
-Sols
Land
230 m2
-Terres
2023-10-31
3 000 
Sale
Land
1050 m2
-Landes
Land
19227 m2
-Taillis sous futaie
2023-10-23
3 000 
Sale
Land
178 m2
-Sols
2023-09-22
10 000 
Exchange
Land
1334 m2
-Sols
Land
410 m2
-Sols
Land
1035 m2
-Sols
Land
475 m2
-Prés
2023-07-05
1 334 
Sale
Land
6080 m2
-Taillis sous futaie
Land
8982 m2
-Futaies résineuses
Land
4400 m2
-Taillis sous futaie
Land
2430 m2
-Landes
Land
4530 m2
-Taillis simples
Land
580 m2
-Taillis sous futaie
2023-07-05
57 000 
456  /m²(125 m²)
Sale
Houses
House
4 rooms
125 m2
Land
252 m2
-Sols
Land
441 m2
-Sols
Land
1710 m2
-Terres
2023-03-10
73 500 
459  /m²(160 m²)
Sale
Houses
House
6 rooms
160 m2
2 outbuildings
Land
1776 m2
-Sols
Land
1397 m2
-Terrains d'agrément
2023-01-30
154 500 
1 104  /m²(140 m²)
Sale
Houses
House
4 rooms
140 m2
1 outbuilding
Land
953 m2
-Sols
Land
60 m2
-Prés
Land
2934 m2
-Landes
Land
550 m2
-Jardins
Land
430 m2
-Eaux
/Bief
Land
258 m2
-Jardins
Land
265 m2
-Prés
Land
365 m2
-Landes
Land
2587 m2
-Prés
Land
45 m2
-Sols
Land
3575 m2
-Terres
Land
1026 m2
-Landes
Land
1880 m2
-Landes
Land
1575 m2
-Landes
Land
1418 m2
-Terres
Land
1055 m2
-Terres
Land
200 m2
-Terres
Land
710 m2
-Prés
Land
800 m2
-Landes
/Patis
Land
96 m2
-Prés
Land
48 m2
-Jardins
2022-12-05
80 
Sale
Land
770 m2
-Landes
56 transactions listed in the municipality

Côte-d'Or (21)

Most expensive cities

City
name
Descending orderHouses
house
Price per m²
3 333 
3 264 
3 218 
3 137 
3 105 
3 047 
3 030 
City
name
Descending orderApartments
apt.
Price per m²
3 394 
3 012 
2 886 
2 846 

Least expensive cities

City
name
Ascending orderHouses
house
Price per m²
210 
225 
250 
274 
287 
287 
357 
City
name
Ascending orderApartments
apt.
Price per m²
58 
65 
74 
79 
112