emooki
HomePrice mapTransactions
🇬🇧 English🇫🇷 Français🇩🇪 Deutsch🇪🇸 Español🇮🇹 Italiano

Real estate price map


Real estate price map in the municipality of Bois-Colombes, choose a section to see transactions by parcel.

Hauts-de-Seine (92)

Bois-Colombes - Real estate price m²

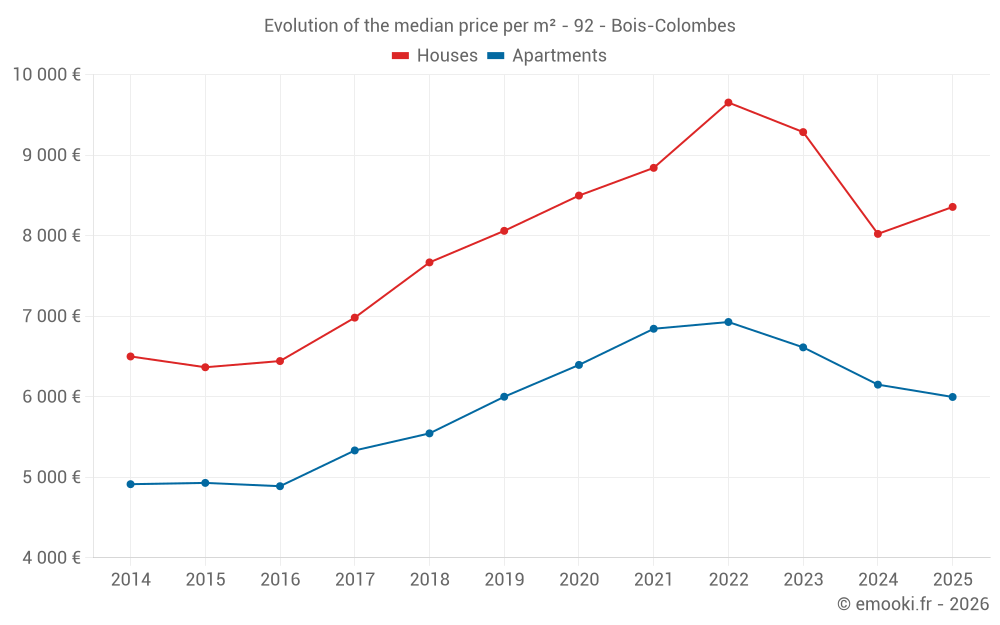
Median price of real estate
in the municipality of Bois-Colombes

HousesHouses
8 357  /m²
1-23-45-67-89-10
Reliability 9/10
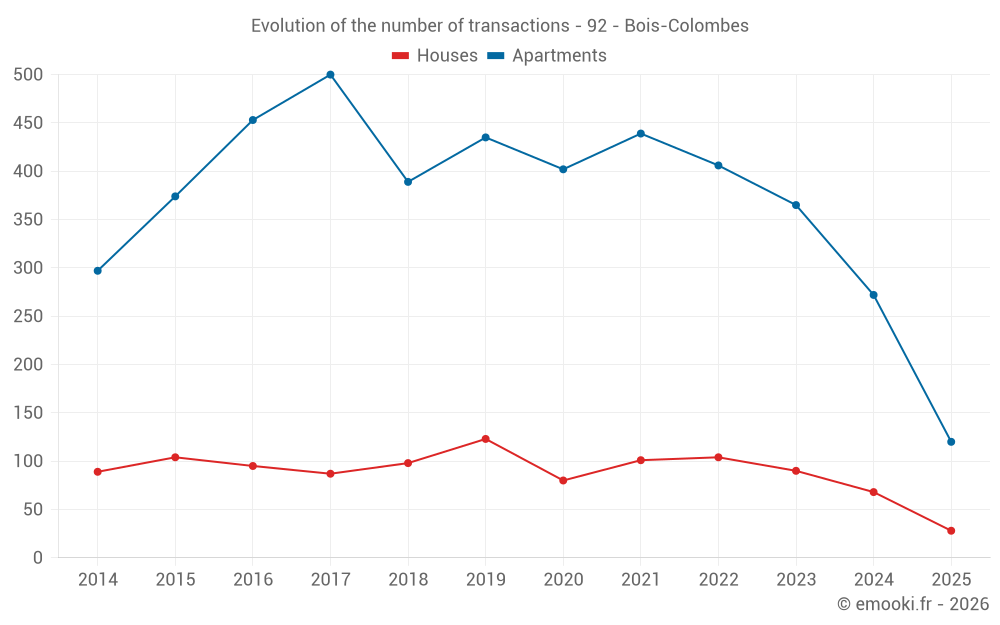
Median price on the 28 transactions of the last 6 months.
from 6 840 to
10 105  /m²
60% of transactions from the 2nd to the 8th deciles.
ApartmentsApartments
6 309  /m²
1-23-45-67-89-10
Reliability 10/10
Median price on the 38 transactions of the last 3 months.
from 4 631 to
7 732  /m²
60% of transactions from the 2nd to the 8th deciles.
DwellingsDwellings
6 582  /m²
1-23-45-67-89-10
Reliability 10/10
Median price on the 48 transactions of the last 3 months.
from 5 329 to
8 259  /m²
60% of transactions from the 2nd to the 8th deciles.
HousesEvolution of the price per m² of houses since...
1 year
+4.2%
2 years
-10%
3 years
-13%
4 years
-5.5%
5 years
-1.7%
6 years
+3.7%
7 years
+9%
8 years
+20%
9 years
+30%
10 years
+31%
11 years
+29%
The price per m² of houses has decreased by 13% since 3 years, but it has increased by 31% in 10 years.
ApartmentsEvolution of the price per m² of apartments since...
1 year
-2.5%
2 years
-9.3%
3 years
-13%
4 years
-12%
5 years
-6.2%
6 years
0%
7 years
+8.2%
8 years
+12%
9 years
+23%
10 years
+22%
11 years
+22%
The price per m² of apartments has decreased by 13% since 3 years, but it has increased by 23% in 9 years.

Yearly evolution

Evolution of the median price per m²

Evolution of the median price per m² - 92 - Bois-Colombes

Evolution of the number of transactions

Warning, last year incomplete. Projections made based on the proportions between semesters of the previous year at the departmental/national level and by type of property.

Evolution of the number of transactions - 92 - Bois-Colombes

Yearly data

Descending order
Year
Houses
house
transactions
Houses
house
Price per m²
Apartments
apt.
transactions
Apartments
apt.
Price per m²
2025
28
8 357 
120
5 997 
2024
68
8 022 
272
6 150 
2023
90
9 286 
365
6 613 
2022
104
9 653 
406
6 928 
2021
101
8 842 
439
6 844 
2020
80
8 498 
402
6 395 
2019
123
8 060 
435
6 000 
2018
98
7 668 
389
5 545 
2017
87
6 982 
500
5 333 
2016
95
6 443 
453
4 889 
2015
104
6 366 
374
4 930 
2014
89
6 500 
297
4 914 

Analysis

Structure of prices per m²

Values of price percentiles per m² over the periods used for the estimated price of each type of property.

Structure of transaction amounts

Values of transaction amounts percentiles over the periods used for the estimated price of each type of property.

Transaction amounts and prices per m² by percentile

Ascending order
Percentile
Houses
house
Price per m²
Houses
house
Transaction amount
Apartments
apt.
Price per m²
Apartments
apt.
Transaction amount
10th percentile
6 065 
376 K
3 729 
176 K
20th percentile
6 840 
639 K
4 631 
195 K
30th percentile
7 224 
671 K
5 444 
230 K
40th percentile
7 668 
687 K
6 010 
253 K
50th percentile
8 357 
848 K
6 309 
313 K
60th percentile
8 745 
940 K
6 529 
376 K
70th percentile
9 238 
1 003 K
7 140 
428 K
80th percentile
10 105 
1 043 K
7 732 
623 K
90th percentile
10 920 
1 166 K
8 562 
735 K

National and departmental comparison

Evolution of the median price per m² of houses

Evolution of the median price per m² of apartments

Quarterly evolution

Evolution of the median price per m²

Evolution of the number of transactions

Quarterly data

Descending order
Quarter
Houses
house
transactions
Houses
house
Price per m²
Apartments
apt.
transactions
Apartments
apt.
Price per m²
2025 Q2
10
8 122 
38
6 309 
2025 Q1
18
8 445 
82
5 944 
2024 Q4
23
7 733 
73
6 111 
2024 Q3
18
7 869 
80
6 246 
2024 Q2
18
8 532 
62
6 164 
2024 Q1
9
8 598 
57
6 196 
2023 Q4
21
9 026 
75
6 500 
2023 Q3
30
9 649 
100
6 536 
2023 Q2
16
9 386 
96
6 658 
2023 Q1
23
8 905 
94
6 674 
2022 Q4
21
8 930 
78
6 822 
2022 Q3
34
9 541 
112
7 148 
2022 Q2
25
10 188 
107
6 946 
2022 Q1
24
9 674 
109
6 775 
2021 Q4
25
9 842 
86
6 946 
2021 Q3
38
8 741 
140
6 998 
2021 Q2
29
8 741 
121
6 803 
2021 Q1
9
7 600 
92
6 475 
2020 Q4
27
8 997 
138
6 487 
2020 Q3
26
8 262 
89
6 709 
2020 Q2
11
8 462 
79
6 250 
2020 Q1
16
7 342 
96
6 054 
2019 Q4
24
8 676 
111
6 143 
2019 Q3
44
7 960 
123
6 018 
2019 Q2
31
7 721 
102
5 860 
2019 Q1
24
8 068 
99
5 929 
2018 Q4
23
8 084 
109
5 658 
2018 Q3
39
7 722 
97
5 697 
2018 Q2
24
7 510 
92
5 372 
2018 Q1
12
6 660 
91
5 366 
2017 Q4
10
7 378 
97
5 352 
2017 Q3
31
7 060 
136
5 444 
2017 Q2
21
6 780 
163
5 255 
2017 Q1
25
6 771 
104
5 346 
2016 Q4
10
7 030 
99
5 093 
2016 Q3
41
6 759 
142
4 876 
2016 Q2
24
6 110 
119
4 778 
2016 Q1
20
5 806 
93
4 866 
2015 Q4
25
6 317 
97
4 843 
2015 Q3
44
6 405 
116
5 010 
2015 Q2
17
5 863 
87
4 774 
2015 Q1
18
6 532 
74
5 124 
2014 Q4
19
6 122 
70
4 881 
2014 Q3
39
6 807 
98
4 882 
2014 Q2
20
6 188 
57
4 971 
2014 Q1
11
5 763 
72
5 000 

Overview of the latest real estate transactions

The following list is an anonymized overview of the latest transactions. For more details and to find all transactions, please use the map to view transactions by plot or the transaction search page for a search by criteria.

2025-06-30
235 000 
6 184  /m²(38 m²)
Sale
Apartments
Apartment
2 rooms
38 m2
1 outbuilding
2025-06-27
613 000 
4 789  /m²(128 m²)
Sale
Apartments
Apartment
5 rooms
128 m2
1 outbuilding
2025-06-24
100 000 
4 000  /m²(25 m²)
Sale
Apartments
Apartment
1 room
25 m2
1 outbuilding
2025-06-24
653 625 
8 489  /m²(77 m²)
Sale
Houses
House
4 rooms
77 m2
Land
192 m2
-Sols
2025-06-20
24 500 
Sale
1 outbuilding
2025-06-20
876 200 
7 754  /m²(113 m²)
Sale
Houses
House
5 rooms
113 m2
Land
123 m2
-Sols
2025-06-19
330 000 
4 521  /m²(73 m²)
Sale
Apartments
Apartment
3 rooms
73 m2
2 outbuildings
2025-06-18
258 000 
4 526  /m²(57 m²)
Sale
Apartments
Apartment
4 rooms
57 m2
1 outbuilding
2025-06-18
1 045 400 
7 210  /m²(145 m²)
Sale
Houses
House
6 rooms
145 m2
1 outbuilding
Land
276 m2
-Sols
2025-06-17
32 000 
Sale
1 outbuilding
2025-06-13
108 500 
Sale
1 outbuilding
2025-06-13
899 700 
6 974  /m²(129 m²)
Sale
Apartments
Apartment
4 rooms
129 m2
2 outbuildings
2025-06-11
230 000 
9 583  /m²(24 m²)
Sale
Apartments
Apartment
1 room
24 m2
2 outbuildings
2025-06-11
44 000 
Sale
2 outbuildings
2025-06-11
1 039 980 
10 947  /m²(95 m²)
Sale
Houses
House
4 rooms
95 m2
1 outbuilding
Land
249 m2
-Sols
2025-06-11
185 000 
2 467  /m²(75 m²)
Sale
Apartments
Apartment
3 rooms
40 m2
Apartments
Apartment
2 rooms
35 m2
1 outbuilding
2025-06-11
3 000 
40  /m²(75 m²)
Exchange
Apartments
Apartment
2 rooms
35 m2
Apartments
Apartment
3 rooms
40 m2
1 outbuilding
2025-06-10
370 000 
6 167  /m²(60 m²)
Sale
1 outbuilding
Apartments
Apartment
4 rooms
60 m2
2 outbuildings
1 outbuilding
2025-06-10
22 000 
Sale
1 outbuilding
2025-06-06
161 000 
3 096  /m²(52 m²)
Sale
Apartments
Apartment
3 rooms
52 m2
7763 transactions listed in the municipality

Hauts-de-Seine (92)

Most expensive cities

City
name
Descending orderHouses
house
Price per m²
16 016 
11 628 
9 715 
9 566 
9 231 
9 146 
8 847 
City
name
Descending orderApartments
apt.
Price per m²
10 322 
8 698 
7 427 
7 273 
6 798 
6 620 
6 509 

Least expensive cities

City
name
Ascending orderHouses
house
Price per m²
5 862 
6 219 
6 630 
6 632 
6 656 
6 662 
City
name
Ascending orderApartments
apt.
Price per m²
4 418 
4 434 
4 724 
4 773 
4 839 
4 868 
4 941 
5 058