emooki
SearchPrice mapTransactions
EnglishFrançaisDeutschEspañolItaliano

Real estate price map


Real estate price map in the municipality of Saulx-les-Chartreux.

Essonne (91)
Saulx-les-Chartreux

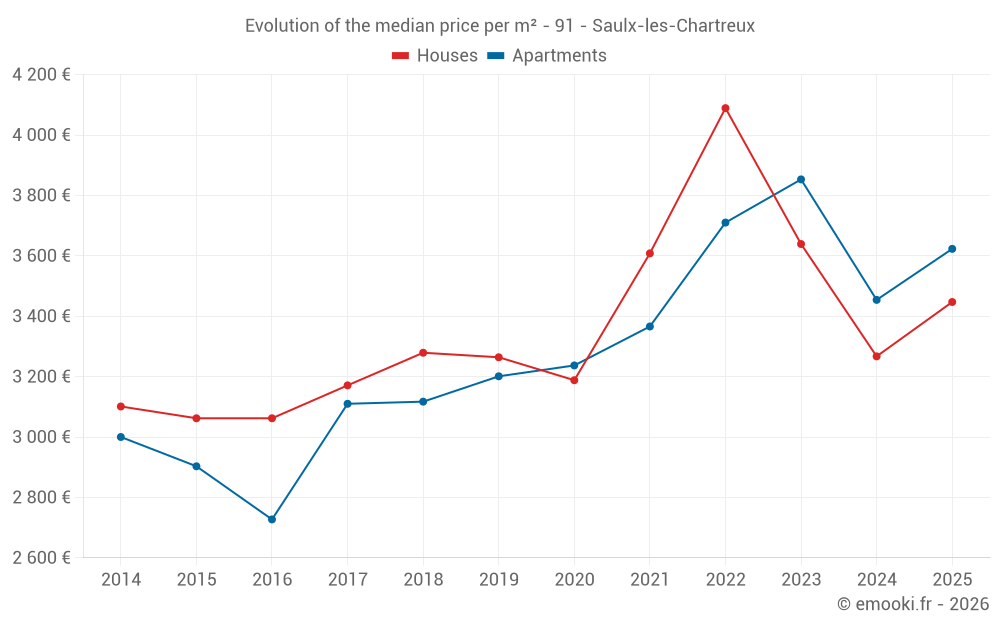
Median price of real estate
in the municipality of Saulx-les-Chartreux

HousesHouses
3 256 € /m²
1-23-45-67-89-10
Reliability 8/10
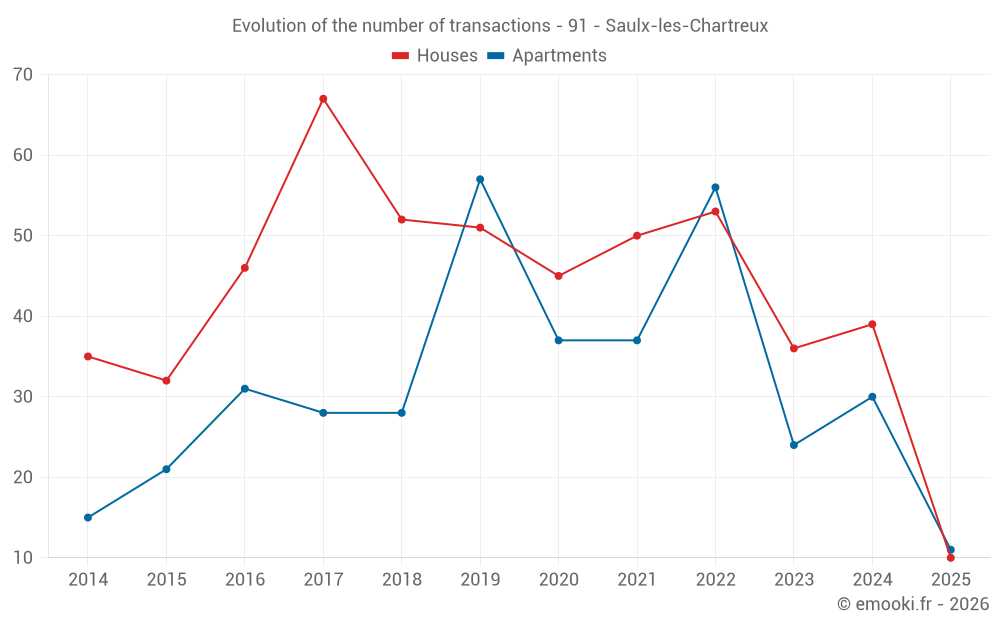
Median price on the 36 transactions of the last 12 months.
from 2 692 to
3 762 € /m²
60% of transactions from the 2nd to the 8th deciles.
ApartmentsApartments
3 429 € /m²
1-23-45-67-89-10
Reliability 8/10
Median price on the 30 transactions of the last 12 months.
from 3 052 to
3 731 € /m²
60% of transactions from the 2nd to the 8th deciles.
DwellingsDwellings
3 561 € /m²
1-23-45-67-89-10
Reliability 9/10
Median price on the 21 transactions of the last 6 months.
from 3 141 to
3 903 € /m²
60% of transactions from the 2nd to the 8th deciles.
HousesEvolution of the price per m² of houses
1 year
+5.5%
2 years
-5.3%
3 years
-15.7%
4 years
-4.5%
5 years
+8.1%
6 years
+5.6%
7 years
+5.1%
8 years
+8.7%
9 years
+12.6%
10 years
+12.6%
11 years
+11.2%
ApartmentsEvolution of the price per m² of apartments
1 year
+4.9%
2 years
-6%
3 years
-2.3%
4 years
+7.6%
5 years
+11.9%
6 years
+13.2%
7 years
+16.2%
8 years
+16.5%
9 years
+32.9%
10 years
+24.8%
11 years
+20.8%

Yearly evolution

Median price per m²

Number of transactions

Warning, last year incomplete. Projections made based on the proportions between semesters of the previous year at the departmental/national level and by type of property.

Yearly data

Descending order
Year
Houses
house
Price per m²
Houses
house
transactions
Apartments
apt.
Price per m²
Apartments
apt.
transactions
2025
3 447 €
10
3 623 €
11
2024
3 267 €
39
3 454 €
30
2023
3 639 €
36
3 853 €
24
2022
4 089 €
53
3 710 €
56
2021
3 608 €
50
3 366 €
37
2020
3 188 €
45
3 237 €
37
2019
3 264 €
51
3 201 €
57
2018
3 279 €
52
3 117 €
28
2017
3 171 €
67
3 110 €
28
2016
3 062 €
46
2 727 €
31
2015
3 062 €
32
2 903 €
21
2014
3 101 €
35
3 000 €
15

Quarterly evolution

Median price per m²

Number of transactions

Analysis

Structure of prices per m²

Values of price percentiles per m² over the periods used for the estimated price of each type of property.

Essonne (91)

Most expensive cities

City
name
Descending orderHouses
house
Price per m²
5 484 €
5 052 €
4 784 €
4 710 €
4 491 €
4 362 €
4 244 €
City
name
Descending orderApartments
apt.
Price per m²
5 783 €
5 520 €
4 708 €
4 222 €
4 212 €
4 198 €

Least expensive cities

City
name
Ascending orderHouses
house
Price per m²
1 714 €
1 801 €
1 833 €
1 868 €
1 905 €
1 914 €
1 967 €
2 000 €
2 095 €
City
name
Ascending orderApartments
apt.
Price per m²
1 066 €
1 135 €
1 194 €
1 209 €
1 354 €
1 719 €
emooki
Real estate statistics based on property value requests (DVF)
Need a specific analysis or dashboards, contact us