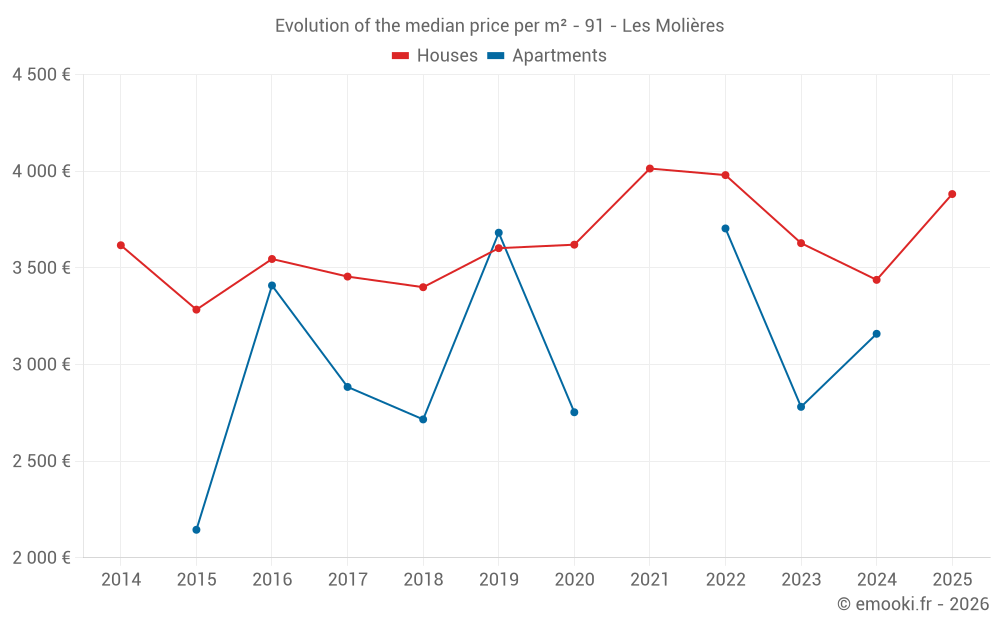
Median price of real estate
in the municipality of Les Molières
Houses
3 686 € /m²
Reliability 8/10
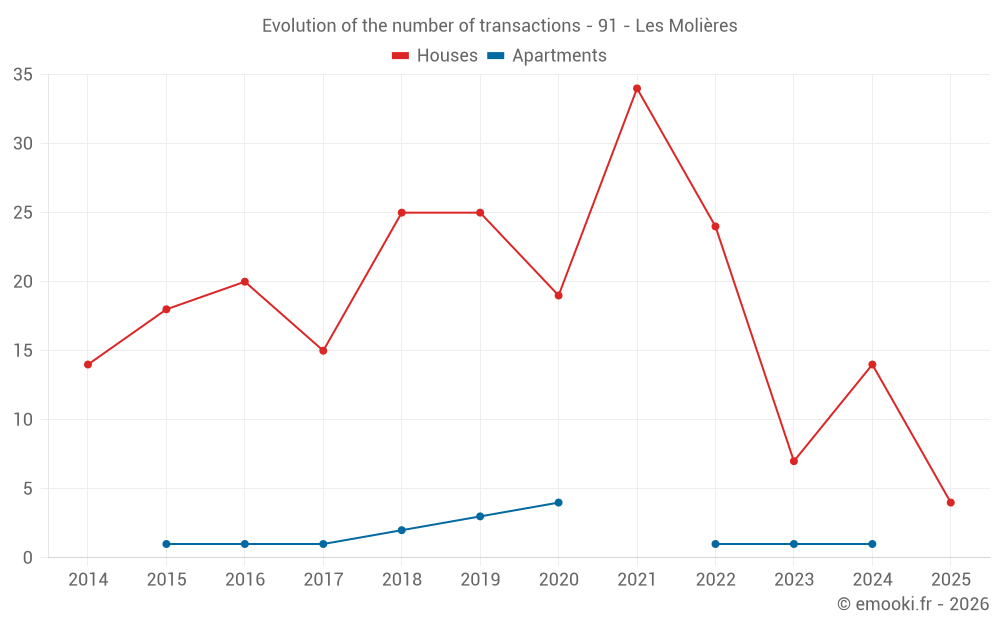
Median price on the 16 transactions of the last 12 months.
from 3 024 to
4 249 € /m²
4 249 € /m²
60% of transactions from the 2nd to the 8th deciles.
Apartments
3 314 € /m²
Reliability 3/10
Median price on the 10 transactions of the last 72 months.
Dwellings
3 686 € /m²
Reliability 8/10
Median price on the 16 transactions of the last 12 months.
from 3 024 to
4 249 € /m²
4 249 € /m²
60% of transactions from the 2nd to the 8th deciles.