emooki
HomePrice mapTransactions
🇬🇧 English🇫🇷 Français🇩🇪 Deutsch🇪🇸 Español🇮🇹 Italiano

Real estate price map


Real estate price map in the municipality of Saint-Rémy-lès-Chevreuse.

Yvelines (78)
Saint-Rémy-lès-Chevreuse

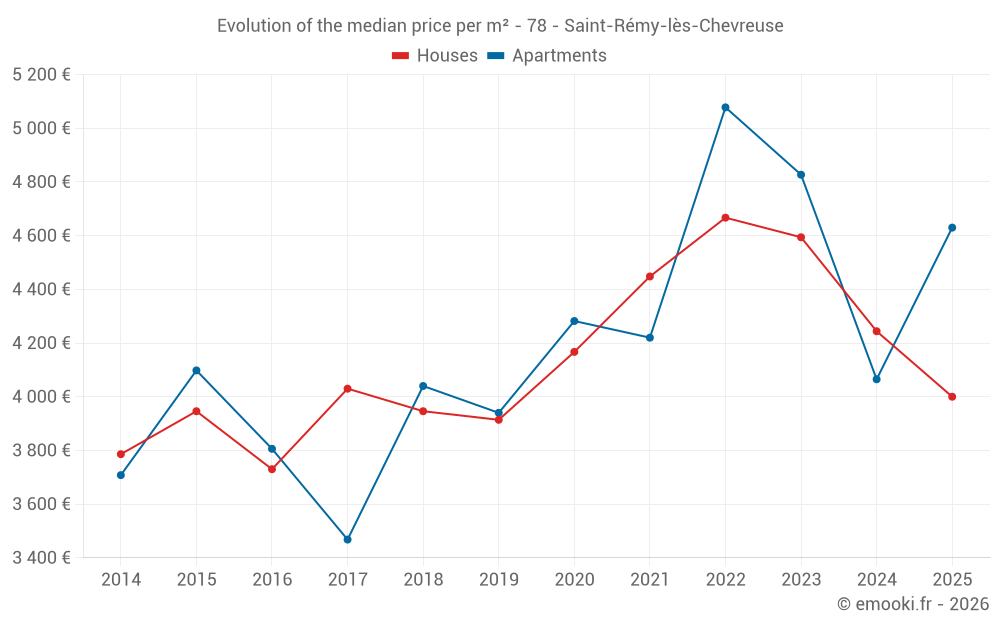
Median price of real estate
in the municipality of Saint-Rémy-lès-Chevreuse

HousesHouses
4 000  /m²
1-23-45-67-89-10
Reliability 9/10
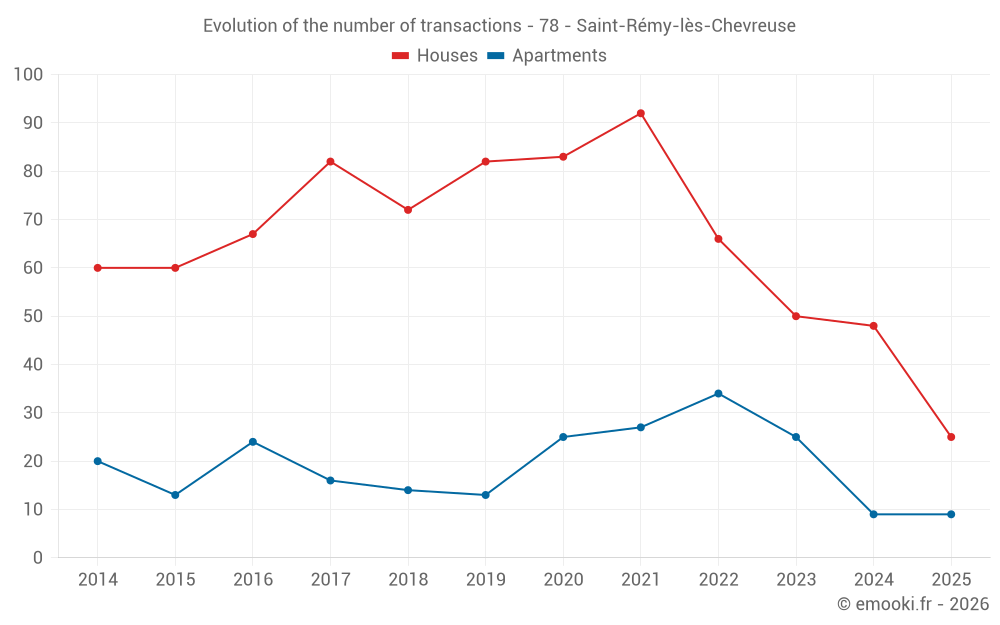
Median price on the 25 transactions of the last 6 months.
from 3 390 to
4 360  /m²
60% of transactions from the 2nd to the 8th deciles.
ApartmentsApartments
4 792  /m²
1-23-45-67-89-10
Reliability 7/10
Median price on the 29 transactions of the last 24 months.
from 3 920 to
5 879  /m²
60% of transactions from the 2nd to the 8th deciles.
DwellingsDwellings
4 038  /m²
1-23-45-67-89-10
Reliability 9/10
Median price on the 34 transactions of the last 6 months.
from 3 460 to
4 754  /m²
60% of transactions from the 2nd to the 8th deciles.
HousesEvolution of the price per m² of houses since...
1 year
-5.7%
2 years
-13%
3 years
-14%
4 years
-10%
5 years
-4%
6 years
+2.2%
7 years
+1.4%
8 years
-0.7%
9 years
+7.2%
10 years
+1.4%
11 years
+5.7%
ApartmentsEvolution of the price per m² of apartments since...
1 year
+14%
2 years
-4.1%
3 years
-8.8%
4 years
+10%
5 years
+8.1%
6 years
+18%
7 years
+15%
8 years
+34%
9 years
+22%
10 years
+13%
11 years
+25%

Yearly evolution

Evolution of the median price per m²

Evolution of the number of transactions

Warning, last year incomplete. Projections made based on the proportions between semesters of the previous year at the departmental/national level and by type of property.

Yearly data

Descending order
Year
Houses
house
transactions
Houses
house
Price per m²
Apartments
apt.
transactions
Apartments
apt.
Price per m²
2025
25
4 000 
9
4 630 
2024
48
4 244 
9
4 065 
2023
50
4 594 
25
4 827 
2022
66
4 667 
34
5 078 
2021
92
4 448 
27
4 220 
2020
83
4 167 
25
4 282 
2019
82
3 914 
13
3 940 
2018
72
3 946 
14
4 040 
2017
82
4 030 
16
3 468 
2016
67
3 730 
24
3 806 
2015
60
3 946 
13
4 098 
2014
60
3 786 
20
3 708 

Analysis

Structure of prices per m²

Values of price percentiles per m² over the periods used for the estimated price of each type of property.

Structure of transaction amounts

Values of transaction amounts percentiles over the periods used for the estimated price of each type of property.

Transaction amounts and prices per m² by percentile

Ascending order
Percentile
Houses
house
Price per m²
Houses
house
Transaction amount
Apartments
apt.
Price per m²
Apartments
apt.
Transaction amount
10th percentile
3 163 
324 K
3 499 
145 K
20th percentile
3 390 
375 K
3 920 
165 K
30th percentile
3 718 
448 K
4 189 
191 K
40th percentile
3 833 
464 K
4 532 
200 K
50th percentile
4 000 
487 K
4 792 
215 K
60th percentile
4 082 
500 K
4 891 
230 K
70th percentile
4 283 
635 K
5 032 
266 K
80th percentile
4 360 
660 K
5 879 
302 K
90th percentile
4 913 
712 K
6 616 
426 K

National and departmental comparison

Evolution of the median price per m² of houses

Evolution of the median price per m² of apartments

Quarterly evolution

Evolution of the median price per m²

Evolution of the number of transactions

Quarterly data

Descending order
Quarter
Houses
house
transactions
Houses
house
Price per m²
Apartments
apt.
transactions
Apartments
apt.
Price per m²
2025 Q2
10
4 213 
3
4 828 
2025 Q1
15
3 889 
6
4 502 
2024 Q4
14
3 728 
2
3 920 
2024 Q3
17
4 318 
3
5 391 
2024 Q2
9
4 064 
2
5 078 
2024 Q1
8
5 334 
2
4 497 
2023 Q4
7
5 439 
6
4 862 
2023 Q3
13
4 680 
5
4 957 
2023 Q2
19
4 492 
7
4 557 
2023 Q1
11
4 368 
7
4 907 
2022 Q4
13
4 358 
12
4 836 
2022 Q3
21
4 667 
12
5 370 
2022 Q2
20
4 757 
7
4 976 
2022 Q1
12
4 688 
3
4 275 
2021 Q4
19
4 662 
6
5 194 
2021 Q3
43
4 565 
7
3 981 
2021 Q2
16
4 014 
12
4 618 
2021 Q1
14
3 912 
2
4 376 
2020 Q4
35
4 520 
7
4 238 
2020 Q3
21
4 086 
7
4 005 
2020 Q2
18
4 210 
4
5 190 
2020 Q1
9
3 333 
7
4 282 
2019 Q4
21
3 699 
5
3 940 
2019 Q3
27
4 081 
2
4 296 
2019 Q2
19
3 652 
2
3 285 
2019 Q1
15
3 957 
4
4 049 
2018 Q4
16
3 986 
3
4 231 
2018 Q3
27
4 199 
6
2 990 
2018 Q2
15
4 091 
2
4 096 
2018 Q1
14
3 452 
3
5 407 
2017 Q4
12
3 869 
5
3 749 
2017 Q3
26
4 472 
6
3 404 
2017 Q2
26
3 803 
4
3 494 
2017 Q1
18
4 059 
1
2 706 
2016 Q4
16
3 935 
6
3 542 
2016 Q3
24
3 789 
5
4 244 
2016 Q2
15
3 730 
5
3 906 
2016 Q1
12
3 454 
8
3 600 
2015 Q4
20
3 880 
1
4 750 
2015 Q3
16
4 074 
4
3 384 
2015 Q2
14
3 626 
7
4 205 
2015 Q1
10
4 298 
1
3 264 
2014 Q4
14
3 714 
6
3 708 
2014 Q3
20
3 914 
3
3 005 
2014 Q2
17
3 652 
7
3 750 
2014 Q1
9
4 194 
4
3 886 

Yvelines (78)

Most expensive cities

City
name
Descending orderHouses
house
Price per m²
7 960 
7 952 
7 768 
7 675 
6 913 
6 748 
6 318 
City
name
Descending orderApartments
apt.
Price per m²
6 192 
5 628 
5 254 
5 250 
5 153 
5 098 
5 056 

Least expensive cities

City
name
Ascending orderHouses
house
Price per m²
1 871 
1 903 
1 953 
1 997 
2 143 
2 192 
2 238 
2 250 
2 254 
City
name
Ascending orderApartments
apt.
Price per m²
729 
1 274 
1 500 
1 526 
1 578 
1 594 
1 675 
1 710