emooki
HomePrice mapTransactions
🇬🇧 English🇫🇷 Français🇩🇪 Deutsch🇪🇸 Español🇮🇹 Italiano

Real estate price map


Real estate price map in the municipality of Limours, choose a section to see transactions by parcel.

Essonne (91)

Limours - Real estate price m²

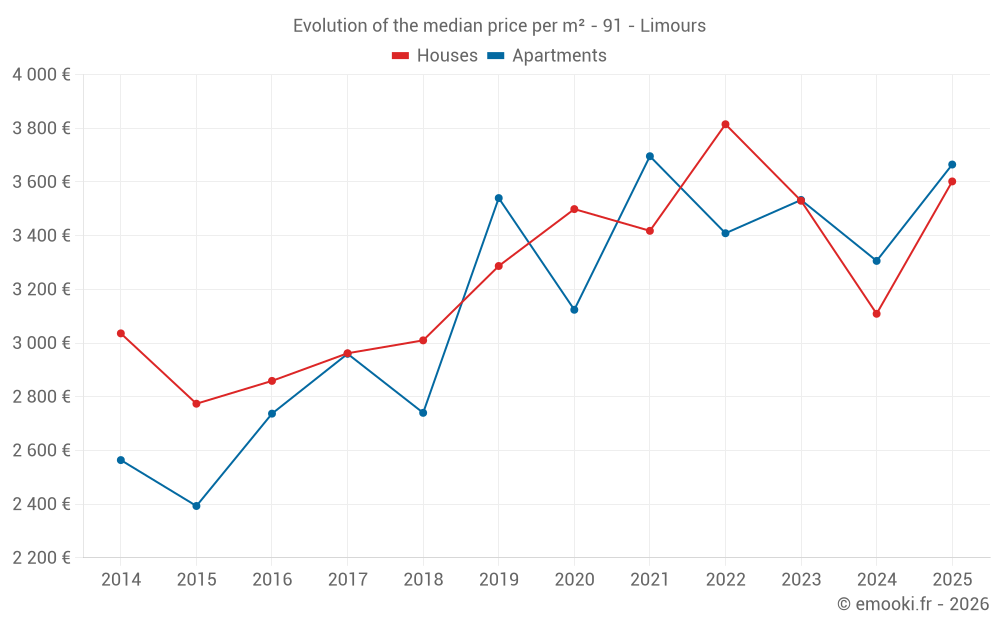
Median price of real estate
in the municipality of Limours

HousesHouses
3 602  /m²
1-23-45-67-89-10
Reliability 9/10
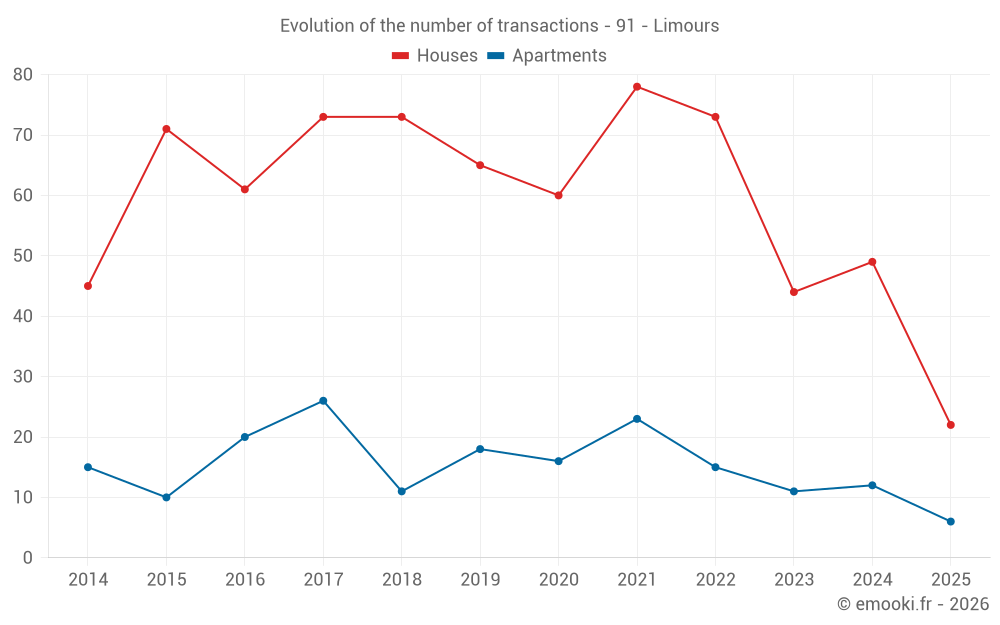
Median price on the 22 transactions of the last 6 months.
from 2 817 to
4 276  /m²
60% of transactions from the 2nd to the 8th deciles.
ApartmentsApartments
3 580  /m²
1-23-45-67-89-10
Reliability 7/10
Median price on the 23 transactions of the last 24 months.
from 3 061 to
3 941  /m²
60% of transactions from the 2nd to the 8th deciles.
DwellingsDwellings
3 602  /m²
1-23-45-67-89-10
Reliability 9/10
Median price on the 28 transactions of the last 6 months.
from 2 985 to
4 275  /m²
60% of transactions from the 2nd to the 8th deciles.
HousesEvolution of the price per m² of houses since...
1 year
+16%
2 years
+2%
3 years
-5.6%
4 years
+5.4%
5 years
+2.9%
6 years
+10%
7 years
+20%
8 years
+22%
9 years
+26%
10 years
+30%
11 years
+19%
The price per m² of houses has decreased by 5.6% since 3 years, but it has increased by 30% in 10 years.
ApartmentsEvolution of the price per m² of apartments since...
1 year
+11%
2 years
+3.7%
3 years
+7.5%
4 years
-0.8%
5 years
+17%
6 years
+3.5%
7 years
+34%
8 years
+24%
9 years
+34%
10 years
+53%
11 years
+43%
The price per m² of apartments has decreased by 0.8% since 4 years, but it has increased by 53% in 10 years.

Yearly evolution

Evolution of the median price per m²

Evolution of the median price per m² - 91 - Limours

Evolution of the number of transactions

Warning, last year incomplete. Projections made based on the proportions between semesters of the previous year at the departmental/national level and by type of property.

Evolution of the number of transactions - 91 - Limours

Yearly data

Descending order
Year
Houses
house
transactions
Houses
house
Price per m²
Apartments
apt.
transactions
Apartments
apt.
Price per m²
2025
22
3 602 
6
3 665 
2024
49
3 109 
12
3 306 
2023
44
3 530 
11
3 533 
2022
73
3 815 
15
3 409 
2021
78
3 418 
23
3 696 
2020
60
3 499 
16
3 124 
2019
65
3 287 
18
3 540 
2018
73
3 010 
11
2 740 
2017
73
2 962 
26
2 960 
2016
61
2 859 
20
2 737 
2015
71
2 774 
10
2 393 
2014
45
3 036 
15
2 564 

Analysis

Structure of prices per m²

Values of price percentiles per m² over the periods used for the estimated price of each type of property.

Structure of transaction amounts

Values of transaction amounts percentiles over the periods used for the estimated price of each type of property.

Transaction amounts and prices per m² by percentile

Ascending order
Percentile
Houses
house
Price per m²
Houses
house
Transaction amount
Apartments
apt.
Price per m²
Apartments
apt.
Transaction amount
10th percentile
2 443 
213 K
2 863 
71 756 
20th percentile
2 817 
244 K
3 061 
88 475 
30th percentile
3 100 
255 K
3 217 
129 K
40th percentile
3 548 
286 K
3 366 
173 K
50th percentile
3 602 
330 K
3 580 
188 K
60th percentile
3 805 
359 K
3 759 
229 K
70th percentile
4 203 
377 K
3 834 
247 K
80th percentile
4 276 
472 K
3 941 
255 K
90th percentile
4 663 
536 K
4 394 
311 K

National and departmental comparison

Evolution of the median price per m² of houses

Evolution of the median price per m² of apartments

Quarterly evolution

Evolution of the median price per m²

Evolution of the number of transactions

Quarterly data

Descending order
Quarter
Houses
house
transactions
Houses
house
Price per m²
Apartments
apt.
transactions
Apartments
apt.
Price per m²
2025 Q2
9
3 809 
3
3 153 
2025 Q1
13
3 600 
3
3 750 
2024 Q4
17
3 232 
5
3 353 
2024 Q3
7
3 007 
3
3 852 
2024 Q2
16
3 038 
2
2 738 
2024 Q1
9
3 330 
2
3 922 
2023 Q4
14
3 466 
3
3 649 
2023 Q3
10
3 280 
2
3 716 
2023 Q2
8
3 454 
2
3 196 
2023 Q1
12
3 586 
4
2 748 
2022 Q4
16
3 946 
3
2 857 
2022 Q3
20
3 706 
6
3 341 
2022 Q2
23
3 933 
4
3 612 
2022 Q1
14
3 648 
2
2 840 
2021 Q4
27
3 422 
3
3 864 
2021 Q3
21
3 425 
4
3 029 
2021 Q2
15
3 414 
8
3 914 
2021 Q1
15
3 023 
8
3 150 
2020 Q4
24
3 737 
3
2 756 
2020 Q3
17
3 305 
4
3 480 
2020 Q2
8
3 737 
5
2 831 
2020 Q1
11
3 222 
4
3 142 
2019 Q4
18
2 792 
4
3 475 
2019 Q3
24
3 478 
6
3 024 
2019 Q2
12
3 112 
3
3 418 
2019 Q1
11
3 500 
5
3 959 
2018 Q4
22
3 356 
2
2 726 
2018 Q3
21
3 200 
4
3 258 
2018 Q2
15
2 733 
2
1 772 
2018 Q1
15
2 766 
3
2 740 
2017 Q4
16
2 814 
6
2 676 
2017 Q3
22
3 289 
8
3 124 
2017 Q2
21
2 832 
6
2 607 
2017 Q1
14
2 964 
6
3 301 
2016 Q4
15
2 658 
3
2 500 
2016 Q3
18
2 863 
7
3 227 
2016 Q2
20
2 894 
5
2 692 
2016 Q1
8
2 890 
5
2 338 
2015 Q4
17
2 750 
3
2 133 
2015 Q3
30
2 890 
3
2 332 
2015 Q2
12
2 753 
3
2 800 
2015 Q1
12
2 634 
1
3 025 
2014 Q4
16
3 058 
4
2 687 
2014 Q3
8
3 452 
4
2 776 
2014 Q2
15
3 028 
3
3 854 
2014 Q1
6
3 375 
4
2 184 

Overview of the latest real estate transactions

The following list is an anonymized overview of the latest transactions. For more details and to find all transactions, please use the map to view transactions by plot or the transaction search page for a search by criteria.

2025-06-26
10 500 
Sale
Land
6340 m2
-Terres
Land
7405 m2
-Terres
2025-06-26
186 000 
3 153  /m²(59 m²)
Sale
Apartments
Apartment
3 rooms
59 m2
1 outbuilding
2025-06-26
390 000 
3 000  /m²(130 m²)
Sale
Houses
House
6 rooms
130 m2
Land
544 m2
-Sols
Land
86 m2
-Sols
Land
111 m2
-Sols
Land
7791 m2
-Terrains à bâtir
Land
31 m2
-Sols
Land
47 m2
-Sols
2025-06-24
492 000 
4 278  /m²(115 m²)
Sale
Houses
House
4 rooms
115 m2
Land
824 m2
-Sols
2025-06-23
99 805 
1 535  /m²(65 m²)
Sale
Houses
House
2 rooms
65 m2
Land
173 m2
-Sols
2025-06-13
588 200 
4 595  /m²(128 m²)
Sale
Houses
House
7 rooms
128 m2
2 outbuildings
Land
1632 m2
-Terrains d'agrément
/Parc
Land
705 m2
-Sols
2025-06-13
371 500 
2 428  /m²(153 m²)
Sale
Houses
House
5 rooms
153 m2
Land
837 m2
-Sols
Land
34 m2
-Sols
2025-06-12
243 000 
4 050  /m²(60 m²)
Sale
Houses
House
4 rooms
60 m2
Land
377 m2
-Sols
2025-06-09
245 311 
4 460  /m²(55 m²)
Sale
Apartments
Apartment
3 rooms
55 m2
3 outbuildings
2025-05-28
66 125 
3 006  /m²(22 m²)
Sale
Apartments
Apartment
1 room
22 m2
1 outbuilding
2025-05-28
134 160 
Sale
Land
1720 m2
-Terrains à bâtir
2025-05-27
265 000 
5 889  /m²(45 m²)
Sale
Houses
House
3 rooms
45 m2
Land
354 m2
-Sols
2025-05-12
540 050 
3 600  /m²(150 m²)
Sale
Houses
House
7 rooms
150 m2
Land
500 m2
-Sols
Land
500 m2
-Terrains d'agrément
/Parc
2025-05-09
537 000 
3 809  /m²(141 m²)
Sale
Houses
House
5 rooms
141 m2
Land
892 m2
-Sols
2025-05-06
624 000 
1 743  /m²(358 m²)
Sale
Commercial property
358 m2
Land
1337 m2
-Terrains à bâtir
2025-04-04
180 000 
Sale
2025-03-29
340 000 
4 857  /m²(70 m²)
Sale
Houses
House
3 rooms
70 m2
5 outbuildings
Land
531 m2
-Terrains d'agrément
/Parc
2025-03-27
127 000 
Sale
2025-03-25
210 000 
3 333  /m²(63 m²)
Sale
Houses
House
3 rooms
63 m2
1 outbuilding
Land
330 m2
-Sols
2025-03-20
239 000 
4 268  /m²(56 m²)
Sale
Houses
House
3 rooms
56 m2
1 outbuilding
1224 transactions listed in the municipality

Essonne (91)

Most expensive cities

City
name
Descending orderHouses
house
Price per m²
5 484 
5 052 
4 784 
4 710 
4 491 
4 362 
4 244 
City
name
Descending orderApartments
apt.
Price per m²
5 783 
5 520 
4 708 
4 222 
4 212 
4 198 

Least expensive cities

City
name
Ascending orderHouses
house
Price per m²
1 714 
1 801 
1 833 
1 868 
1 905 
1 914 
1 967 
2 000 
2 095 
City
name
Ascending orderApartments
apt.
Price per m²
1 066 
1 135 
1 194 
1 209 
1 354 
1 719