emooki
HomePrice mapTransactions
🇬🇧 English🇫🇷 Français🇩🇪 Deutsch🇪🇸 Español🇮🇹 Italiano

Real estate price map


Real estate price map in the municipality of Bondoufle, choose a section to see transactions by parcel.

Essonne (91)

Bondoufle - Real estate price m²

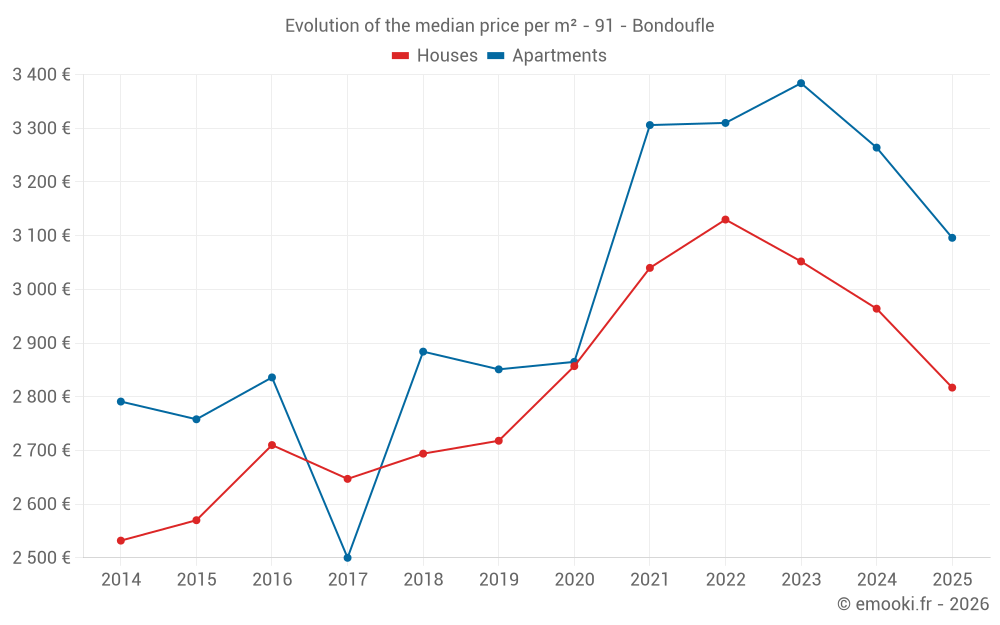
Median price of real estate
in the municipality of Bondoufle

HousesHouses
2 817  /m²
1-23-45-67-89-10
Reliability 9/10
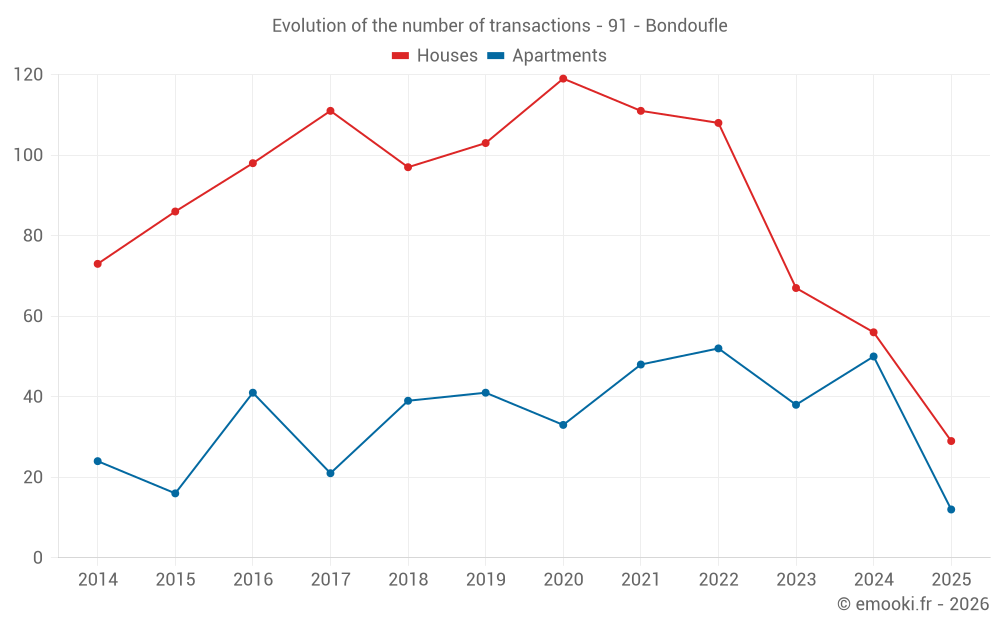
Median price on the 29 transactions of the last 6 months.
from 2 360 to
3 111  /m²
60% of transactions from the 2nd to the 8th deciles.
ApartmentsApartments
3 249  /m²
1-23-45-67-89-10
Reliability 8/10
Median price on the 45 transactions of the last 12 months.
from 3 051 to
3 525  /m²
60% of transactions from the 2nd to the 8th deciles.
DwellingsDwellings
2 949  /m²
1-23-45-67-89-10
Reliability 9/10
Median price on the 41 transactions of the last 6 months.
from 2 588 to
3 379  /m²
60% of transactions from the 2nd to the 8th deciles.
HousesEvolution of the price per m² of houses since...
1 year
-5%
2 years
-7.7%
3 years
-10%
4 years
-7.3%
5 years
-1.4%
6 years
+3.6%
7 years
+4.6%
8 years
+6.4%
9 years
+3.9%
10 years
+10%
11 years
+11%
The price per m² of houses has decreased by 10% since 3 years, but it has increased by 11% in 11 years.
ApartmentsEvolution of the price per m² of apartments since...
1 year
-5.1%
2 years
-8.5%
3 years
-6.5%
4 years
-6.4%
5 years
+8.1%
6 years
+8.6%
7 years
+7.4%
8 years
+24%
9 years
+9.2%
10 years
+12%
11 years
+11%
The price per m² of apartments has decreased by 8.5% since 2 years, but it has increased by 24% in 8 years.

Yearly evolution

Evolution of the median price per m²

Evolution of the median price per m² - 91 - Bondoufle

Evolution of the number of transactions

Warning, last year incomplete. Projections made based on the proportions between semesters of the previous year at the departmental/national level and by type of property.

Evolution of the number of transactions - 91 - Bondoufle

Yearly data

Descending order
Year
Houses
house
transactions
Houses
house
Price per m²
Apartments
apt.
transactions
Apartments
apt.
Price per m²
2025
29
2 817 
12
3 096 
2024
56
2 964 
50
3 264 
2023
67
3 052 
38
3 384 
2022
108
3 130 
52
3 310 
2021
111
3 040 
48
3 306 
2020
119
2 857 
33
2 865 
2019
103
2 718 
41
2 851 
2018
97
2 694 
39
2 884 
2017
111
2 647 
21
2 500 
2016
98
2 710 
41
2 836 
2015
86
2 570 
16
2 758 
2014
73
2 532 
24
2 791 

Analysis

Structure of prices per m²

Values of price percentiles per m² over the periods used for the estimated price of each type of property.

Structure of transaction amounts

Values of transaction amounts percentiles over the periods used for the estimated price of each type of property.

Transaction amounts and prices per m² by percentile

Ascending order
Percentile
Houses
house
Price per m²
Houses
house
Transaction amount
Apartments
apt.
Price per m²
Apartments
apt.
Transaction amount
10th percentile
2 045 
219 K
2 896 
126 K
20th percentile
2 360 
231 K
3 051 
130 K
30th percentile
2 649 
237 K
3 151 
145 K
40th percentile
2 711 
245 K
3 216 
156 K
50th percentile
2 817 
250 K
3 249 
182 K
60th percentile
2 948 
262 K
3 278 
185 K
70th percentile
3 000 
289 K
3 350 
189 K
80th percentile
3 111 
358 K
3 525 
211 K
90th percentile
3 572 
400 K
3 626 
232 K

National and departmental comparison

Evolution of the median price per m² of houses

Evolution of the median price per m² of apartments

Quarterly evolution

Evolution of the median price per m²

Evolution of the number of transactions

Quarterly data

Descending order
Quarter
Houses
house
transactions
Houses
house
Price per m²
Apartments
apt.
transactions
Apartments
apt.
Price per m²
2025 Q2
9
2 959 
2
3 152 
2025 Q1
20
2 720 
10
3 086 
2024 Q4
11
3 198 
11
3 215 
2024 Q3
25
2 952 
22
3 271 
2024 Q2
12
2 722 
6
3 424 
2024 Q1
8
2 864 
11
3 213 
2023 Q4
12
2 852 
6
3 213 
2023 Q3
26
3 082 
10
3 238 
2023 Q2
16
3 180 
8
3 595 
2023 Q1
13
2 966 
14
3 371 
2022 Q4
24
3 139 
5
3 209 
2022 Q3
37
3 077 
12
3 416 
2022 Q2
27
3 087 
12
3 152 
2022 Q1
20
3 273 
23
3 500 
2021 Q4
26
3 062 
14
3 272 
2021 Q3
38
3 092 
12
3 308 
2021 Q2
27
3 054 
16
3 393 
2021 Q1
20
2 870 
6
2 882 
2020 Q4
42
2 902 
8
2 864 
2020 Q3
29
2 906 
9
2 852 
2020 Q2
31
2 750 
4
2 844 
2020 Q1
17
2 692 
12
2 885 
2019 Q4
25
2 802 
10
3 022 
2019 Q3
31
2 614 
14
2 744 
2019 Q2
25
2 738 
9
2 770 
2019 Q1
22
2 680 
8
2 816 
2018 Q4
28
2 702 
12
3 027 
2018 Q3
33
2 730 
10
2 460 
2018 Q2
19
2 729 
9
2 971 
2018 Q1
17
2 485 
8
2 790 
2017 Q4
25
2 727 
5
2 635 
2017 Q3
24
2 488 
1
2 221 
2017 Q2
26
2 516 
9
2 607 
2017 Q1
36
2 659 
6
2 406 
2016 Q4
22
2 602 
10
2 690 
2016 Q3
33
2 690 
13
3 352 
2016 Q2
21
2 877 
9
2 791 
2016 Q1
22
2 517 
9
2 773 
2015 Q4
27
2 563 
4
2 609 
2015 Q3
24
2 553 
2
2 838 
2015 Q2
16
2 658 
7
2 772 
2015 Q1
19
2 582 
3
2 871 
2014 Q4
13
2 671 
3
2 546 
2014 Q3
21
2 596 
4
2 780 
2014 Q2
20
2 452 
7
3 083 
2014 Q1
19
2 386 
10
2 914 

Overview of the latest real estate transactions

The following list is an anonymized overview of the latest transactions. For more details and to find all transactions, please use the map to view transactions by plot or the transaction search page for a search by criteria.

2025-06-06
390 000 
2 786  /m²(140 m²)
Sale
Houses
House
8 rooms
140 m2
Land
619 m2
-Sols
2025-05-28
197 000 
1 990  /m²(99 m²)
Sale
Houses
House
5 rooms
99 m2
Land
144 m2
-Sols
2025-05-27
2 070 
Sale
Land
27 m2
-Sols
2025-05-06
250 000 
2 551  /m²(98 m²)
Sale
Houses
House
5 rooms
98 m2
Land
118 m2
-Sols
2025-05-06
422 400 
3 379  /m²(125 m²)
Sale
Houses
House
6 rooms
125 m2
Land
552 m2
-Sols
2025-05-06
247 415 
2 945  /m²(84 m²)
Sale
Houses
House
4 rooms
84 m2
Land
163 m2
-Sols
2025-04-30
290 000 
2 959  /m²(98 m²)
Sale
Houses
House
5 rooms
98 m2
Land
524 m2
-Sols
2025-04-29
125 440 
3 216  /m²(39 m²)
Sale
Apartments
Apartment
2 rooms
39 m2
1 outbuilding
2025-04-28
232 000 
3 013  /m²(77 m²)
Sale
Houses
House
4 rooms
77 m2
Land
111 m2
-Sols
2025-04-25
210 000 
3 088  /m²(68 m²)
Sale
Apartments
Apartment
4 rooms
68 m2
1 outbuilding
2025-04-25
1 0
Sale
Commercial property
1296 m2
Land
2861 m2
-Terrains d'agrément
Land
1000 m2
-Sols
2025-04-24
9 180 000 
444  /m²(20689 m²)
Sale
Commercial property
20689 m2
Land
13141 m2
-Sols
2025-04-18
288 000 
3 512  /m²(82 m²)
Sale
Houses
House
4 rooms
82 m2
Land
453 m2
-Sols
2025-04-16
385 000 
3 812  /m²(101 m²)
Sale
Houses
House
5 rooms
101 m2
Land
587 m2
-Sols
2025-03-31
245 000 
2 059  /m²(119 m²)
Sale
Houses
House
6 rooms
119 m2
Land
107 m2
-Sols
Land
9 m2
-Sols
2025-03-31
1 150 000 
1 153  /m²(997 m²)
Sale
Commercial property
997 m2
Land
2812 m2
-Sols
2025-03-28
208 000 
3 104  /m²(67 m²)
Sale
Apartments
Apartment
3 rooms
67 m2
2 outbuildings
2025-03-28
157 000 
3 568  /m²(44 m²)
Sale
Apartments
Apartment
2 rooms
44 m2
1 outbuilding
2025-03-26
160 000 
1 368  /m²(117 m²)
Sale
Houses
House
6 rooms
117 m2
Land
416 m2
-Sols
2025-03-24
235 000 
3 052  /m²(77 m²)
Sale
Houses
House
4 rooms
77 m2
Land
110 m2
-Sols
2613 transactions listed in the municipality

Essonne (91)

Most expensive cities

City
name
Descending orderHouses
house
Price per m²
5 484 
5 052 
4 784 
4 710 
4 491 
4 362 
4 244 
City
name
Descending orderApartments
apt.
Price per m²
5 783 
5 520 
4 708 
4 222 
4 212 
4 198 

Least expensive cities

City
name
Ascending orderHouses
house
Price per m²
1 714 
1 801 
1 833 
1 868 
1 905 
1 914 
1 967 
2 000 
2 095 
City
name
Ascending orderApartments
apt.
Price per m²
1 066 
1 135 
1 194 
1 209 
1 354 
1 719