Real estate price map
Real estate price map in the municipality of Domèvre-sur-Durbion, choose a section to see transactions by parcel.
Vosges (88)
Price per m² in Domèvre-sur-Durbion
Median price of real estate
in the municipality of Domèvre-sur-Durbion
Houses
852 € /m²
Reliability 4/10
Median price on the 13 transactions of the last 60 months.
from 565 to
1 590 € /m²
1 590 € /m²
60% of transactions from the 2nd to the 8th deciles.
Apartments
842 € /m²
Reliability 1/10
Median price on the 2 transactions of the last 120 months.
Dwellings
1 037 € /m²
Reliability 5/10
Median price on the 10 transactions of the last 48 months.
Yearly evolution
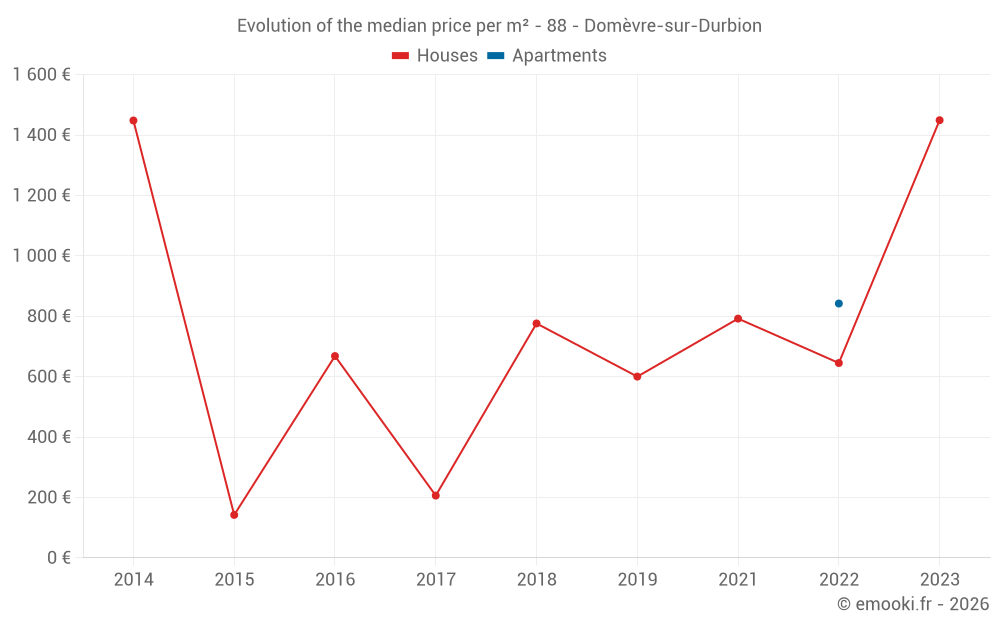
Evolution of the median price per m²
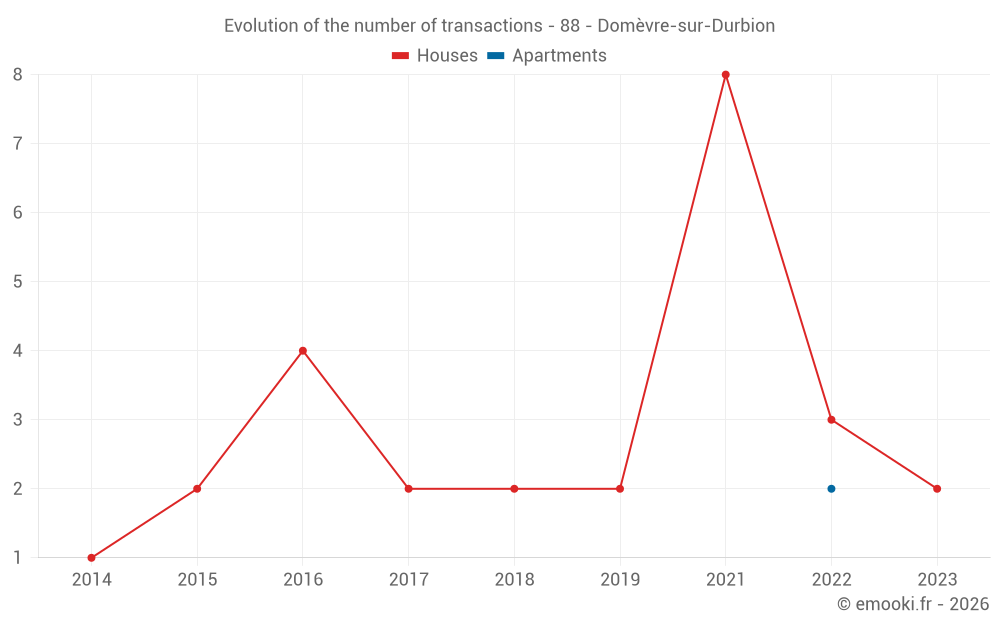
Evolution of the number of transactions
Warning, last year incomplete. Projections made based on the proportions between semesters of the previous year at the departmental/national level and by type of property.
Yearly data
Year
house
transactions
transactions
house
Price per m²
Price per m²
apt.
transactions
transactions
apt.
Price per m²
Price per m²
2025
0
--- €
0
--- €
2024
0
--- €
0
--- €
2023
2
1 449 €
0
--- €
2022
3
645 €
2
842 €
2021
8
792 €
0
--- €
2020
0
--- €
0
--- €
2019
2
600 €
0
--- €
2018
2
776 €
0
--- €
2017
2
206 €
0
--- €
2016
4
668 €
0
--- €
2015
2
142 €
0
--- €
2014
1
1 448 €
0
--- €
Analysis
Structure of prices per m²
Values of price percentiles per m² over the periods used for the estimated price of each type of property.
Structure of transaction amounts
Values of transaction amounts percentiles over the periods used for the estimated price of each type of property.
Transaction amounts and prices per m² by percentile
Percentile
house
Price per m²
Price per m²
house
Transaction amount
Transaction amount
apt.
Price per m²
Price per m²
apt.
Transaction amount
Transaction amount
10th percentile
451 €
32 900 €
508 €
69 700 €
20th percentile
565 €
50 700 €
592 €
76 400 €
30th percentile
625 €
69 000 €
676 €
83 100 €
40th percentile
715 €
83 000 €
759 €
89 800 €
50th percentile
852 €
90 000 €
842 €
96 500 €
60th percentile
1 000 €
100 K€
926 €
103 K€
70th percentile
1 248 €
128 K€
1 010 €
110 K€
80th percentile
1 590 €
146 K€
1 093 €
117 K€
90th percentile
1 773 €
188 K€
1 176 €
123 K€
National and departmental comparison
Evolution of the median price per m² of houses
Evolution of the median price per m² of apartments
Quarterly evolution
Evolution of the median price per m²
Evolution of the number of transactions
Quarterly data
Quarter
house
transactions
transactions
house
Price per m²
Price per m²
apt.
transactions
transactions
apt.
Price per m²
Price per m²
2023 Q3
1
1 800 €
0
--- €
2023 Q2
1
1 098 €
0
--- €
2022 Q4
1
645 €
1
425 €
2022 Q3
0
--- €
1
1 260 €
2022 Q2
1
594 €
0
--- €
2022 Q1
1
1 474 €
0
--- €
2021 Q3
3
976 €
0
--- €
2021 Q2
3
427 €
0
--- €
2021 Q1
2
1 260 €
0
--- €
2019 Q3
2
600 €
0
--- €
2018 Q2
1
1 026 €
0
--- €
2018 Q1
1
526 €
0
--- €
2017 Q3
1
50 €
0
--- €
2017 Q1
1
363 €
0
--- €
2016 Q4
1
1 759 €
0
--- €
2016 Q3
1
851 €
0
--- €
2016 Q1
2
343 €
0
--- €
2015 Q4
1
46 €
0
--- €
2015 Q3
1
238 €
0
--- €
2014 Q2
1
1 448 €
0
--- €
Overview of the latest real estate transactions
The following list is an anonymized overview of the latest transactions. For more details and to find all transactions, please use the map to view transactions by plot or the transaction search page for a search by criteria.
2025-06-23
7 000 €Sale
Land
80 m2
-Sols
Land
16 m2
-Sols
2025-03-24
9 244 €Sale
Land
296 m2
-Vergers
Land
292 m2
-Vergers
2025-03-22
17 000 €Sale
Land
1067 m2
-Prés
2025-03-05
1 000 €Sale
Land
3980 m2
-Bois
/AULN
2025-02-17
40 000 €Sale
Land
2355 m2
-Prés
2024-12-27
800 €Sale
Land
2080 m2
-Prés
Land
3575 m2
-Bois
/AULN
2024-08-09
9 500 €Sale
Land
2500 m2
-Terres
Land
820 m2
-Terres
Land
1490 m2
-Terres
Land
1660 m2
-Terres
Land
3390 m2
-Terres
Land
5920 m2
-Terres
Land
2210 m2
-Terres
Land
1750 m2
-Terres
2024-07-25
1 500 €Sale
Land
2370 m2
-Futaies résineuses
2024-03-02
1 960 €Sale
Land
98 m2
-Prés
2024-03-01
1 500 €Exchange
Land
2370 m2
-Futaies résineuses
Land
2880 m2
-Futaies résineuses
2023-12-07
420 €Sale
Land
400 m2
-Bois
/AULN
2023-12-07
1 650 €Sale
Land
815 m2
-Bois
/AULN
Land
60 m2
-Bois
/AULN
Land
115 m2
-Bois
/AULN
Land
1330 m2
-Bois
/AULN
Land
1270 m2
-Bois
/AULN
2023-12-07
1 900 €Sale
Land
2250 m2
-Bois
/AULN
2023-10-24
140 000 €146 € /m²(960 m²)
Sale
Commercial property
960 m2
Land
14546 m2
-Sols
2023-09-28
225 000 €1 800 € /m²(125 m²)
Sale
House
5 rooms
125 m2
Land
724 m2
-Sols
Land
806 m2
-Prés
2023-08-09
33 150 €Sale
Land
3480 m2
-Futaies résineuses
Land
16780 m2
-Bois
/AULN
Land
9070 m2
-Futaies résineuses
Land
13980 m2
-Futaies résineuses
Land
1890 m2
-Bois
/AULN
Land
1410 m2
-Bois
/AULN
Land
1330 m2
-Futaies résineuses
Land
2780 m2
-Taillis sous futaie
Land
2360 m2
-Taillis sous futaie
Land
850 m2
-Taillis sous futaie
Land
4215 m2
-Futaies résineuses
Land
3700 m2
-Futaies résineuses
Land
2040 m2
-Futaies résineuses
Land
2330 m2
-Bois
/AULN
2023-07-24
1 500 €Sale
Land
1353 m2
-Taillis sous futaie
Land
2370 m2
-Futaies résineuses
2023-05-17
90 000 €1 098 € /m²(82 m²)
Sale
House
3 rooms
82 m2
Land
745 m2
-Sols
Land
1255 m2
-Prés
2023-03-13
1 700 €Sale
Land
540 m2
-Vergers
2022-11-16
130 000 €425 € /m²(306 m²)
Sale
Apartment
4 rooms
153 m2
Apartment
5 rooms
153 m2
4 outbuildings
Land
471 m2
-Sols
111 transactions listed in the municipality
Compare with neighboring municipalities
City
name
name
house
Price per m²
Price per m²
apt.
Price per m²
Price per m²
City information
Zip code
- 88330 DOMEVRE SUR DURBION
Data source & update
- Latest publication of the property value request (DVF) database made available by the DGFiP on October 19, 2025, covering transactions up to 06/30/2025:
- Administrative/cadastral division as of September 1, 2025, and municipal movements as of January 1, 2025: