Real estate price map
Real estate price map in the municipality of Blevaincourt, choose a section to see transactions by parcel.
Vosges (88)
Price per m² in Blevaincourt
Median price of real estate
in the municipality of Blevaincourt
Houses
177 € /m²
Reliability 5/10
Median price on the 12 transactions of the last 48 months.
from 43 to
362 € /m²
362 € /m²
60% of transactions from the 2nd to the 8th deciles.
Yearly evolution
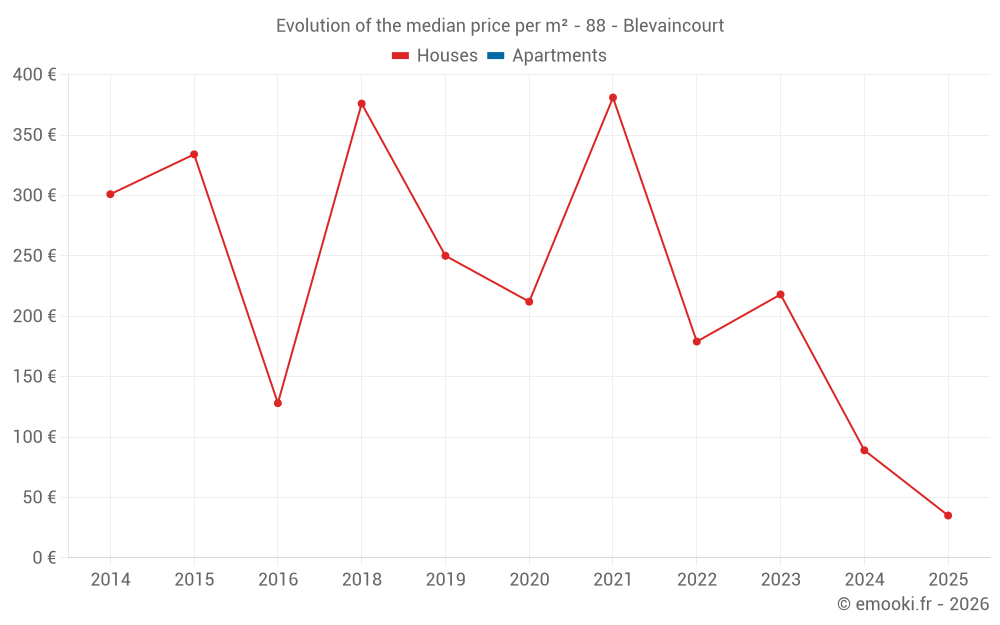
Evolution of the median price per m²
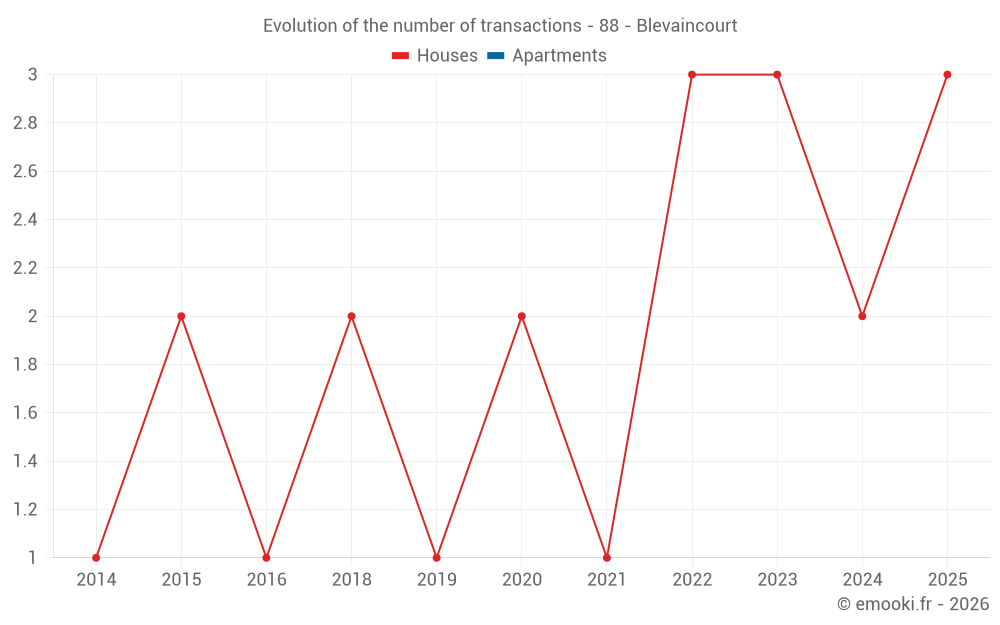
Evolution of the number of transactions
Warning, last year incomplete. Projections made based on the proportions between semesters of the previous year at the departmental/national level and by type of property.
Yearly data
Year
house
transactions
transactions
house
Price per m²
Price per m²
apt.
transactions
transactions
apt.
Price per m²
Price per m²
2025
3
35 €
0
--- €
2024
2
89 €
0
--- €
2023
3
218 €
0
--- €
2022
3
179 €
0
--- €
2021
1
381 €
0
--- €
2020
2
212 €
0
--- €
2019
1
250 €
0
--- €
2018
2
376 €
0
--- €
2017
0
--- €
0
--- €
2016
1
128 €
0
--- €
2015
2
334 €
0
--- €
2014
1
301 €
0
--- €
Analysis
Structure of prices per m²
Values of price percentiles per m² over the periods used for the estimated price of each type of property.
Structure of transaction amounts
Values of transaction amounts percentiles over the periods used for the estimated price of each type of property.
Transaction amounts and prices per m² by percentile
Percentile
house
Price per m²
Price per m²
house
Transaction amount
Transaction amount
apt.
Price per m²
Price per m²
apt.
Transaction amount
Transaction amount
10th percentile
33 €
2 100 €
--- €
--- €
20th percentile
43 €
3 400 €
--- €
--- €
30th percentile
83 €
5 600 €
--- €
--- €
40th percentile
129 €
9 000 €
--- €
--- €
50th percentile
177 €
13 250 €
--- €
--- €
60th percentile
202 €
19 193 €
--- €
--- €
70th percentile
267 €
22 796 €
--- €
--- €
80th percentile
362 €
30 600 €
--- €
--- €
90th percentile
391 €
39 250 €
--- €
--- €
National and departmental comparison
Evolution of the median price per m² of houses
Evolution of the median price per m² of apartments
Quarterly evolution
Evolution of the median price per m²
Evolution of the number of transactions
Quarterly data
Quarter
house
transactions
transactions
house
Price per m²
Price per m²
apt.
transactions
transactions
apt.
Price per m²
Price per m²
2025 Q2
2
34 €
0
--- €
2025 Q1
1
392 €
0
--- €
2024 Q3
2
89 €
0
--- €
2023 Q3
1
218 €
0
--- €
2023 Q1
2
382 €
0
--- €
2022 Q4
1
77 €
0
--- €
2022 Q2
1
179 €
0
--- €
2022 Q1
1
288 €
0
--- €
2021 Q3
1
381 €
0
--- €
2020 Q3
2
212 €
0
--- €
2019 Q3
1
250 €
0
--- €
2018 Q3
1
625 €
0
--- €
2018 Q1
1
128 €
0
--- €
2016 Q2
1
128 €
0
--- €
2015 Q4
1
313 €
0
--- €
2015 Q2
1
356 €
0
--- €
2014 Q4
1
301 €
0
--- €
Overview of the latest real estate transactions
The following list is an anonymized overview of the latest transactions. For more details and to find all transactions, please use the map to view transactions by plot or the transaction search page for a search by criteria.
2025-04-16
3 000 €35 € /m²(85 m²)
Sale
House
2 rooms
85 m2
Land
1837 m2
-Prés
Land
1311 m2
-Sols
2025-04-16
2 000 €33 € /m²(60 m²)
Sale
House
2 rooms
60 m2
Land
539 m2
-Sols
Land
3631 m2
-Prés
2025-04-16
35 250 €Sale
Land
35798 m2
-Prés
Land
17898 m2
-Prés
Land
23570 m2
-Prés
Land
3000 m2
-Prés
Land
7147 m2
-Prés
2025-03-14
3 200 €Sale
Land
24505 m2
-Futaies résineuses
Land
5600 m2
-Peupleraies
Land
1200 m2
-Taillis simples
Land
7570 m2
-Peupleraies
Land
2565 m2
-Peupleraies
Land
4099 m2
-Futaies résineuses
2025-03-10
300 €Exchange
Land
85 m2
-Jardins
Land
173 m2
-Jardins
Land
14 m2
-Sols
2025-02-28
32 500 €392 € /m²(83 m²)
Sale
House
4 rooms
83 m2
Land
1026 m2
-Prés
Land
484 m2
-Sols
2024-08-20
1 000 €Sale
Land
948 m2
-Prés
2024-08-08
400 €3 € /m²(150 m²)
Sale
House
5 rooms
150 m2
Land
472 m2
-Sols
Land
578 m2
-Jardins
2024-08-08
4 370 €Sale
Land
2801 m2
-Prés
Land
9459 m2
-Prés
2024-08-06
10 000 €Sale
Land
1541 m2
-Prés
Land
2458 m2
-Sols
2024-07-29
7 000 €175 € /m²(40 m²)
Sale
House
1 room
40 m2
Land
201 m2
-Sols
2024-05-07
2 599 €Sale
Land
6120 m2
-Prés
Land
2543 m2
-Prés
2024-04-20
5 000 €33 € /m²(150 m²)
Sale
Commercial property
150 m2
Land
900 m2
-Sols
Land
1210 m2
-Prés
2024-03-01
17 466 €Sale
Land
21833 m2
-Prés
Land
21832 m2
-Prés
2024-01-22
600 €Sale
Land
1340 m2
-Prés
2023-08-02
2 500 €Sale
Land
1053 m2
-Prés
2023-07-17
12 000 €218 € /m²(55 m²)
Sale
House
2 rooms
55 m2
Land
276 m2
-Sols
Land
74 m2
-Jardins
2023-04-28
318 376 €Sale
Land
20000 m2
-Prés
Land
9000 m2
-Sols
Land
13842 m2
-Prés
2023-02-08
14 500 €98 € /m²(148 m²)
Sale
House
4 rooms
148 m2
Land
534 m2
-Jardins
Land
606 m2
-Sols
2023-01-17
40 000 €667 € /m²(60 m²)
Sale
House
3 rooms
60 m2
Land
560 m2
-Jardins
Land
403 m2
-Sols
49 transactions listed in the municipality
Compare with neighboring municipalities
City
name
name
house
Price per m²
Price per m²
apt.
Price per m²
Price per m²
City information
Zip code
- 88320 BLEVAINCOURT
Data source & update
- Latest publication of the property value request (DVF) database made available by the DGFiP on October 19, 2025, covering transactions up to 06/30/2025:
- Administrative/cadastral division as of September 1, 2025, and municipal movements as of January 1, 2025: