emooki
HomePrice mapTransactions
🇬🇧 English🇫🇷 Français🇩🇪 Deutsch🇪🇸 Español🇮🇹 Italiano

Real estate price map


Real estate price map in the Vosges department.

Department 88
Vosges

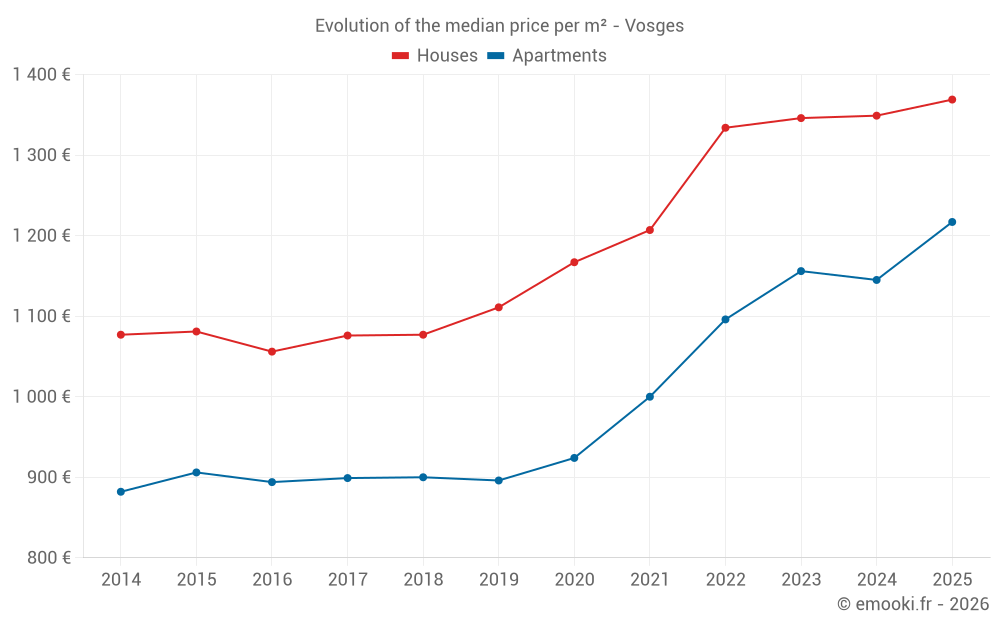
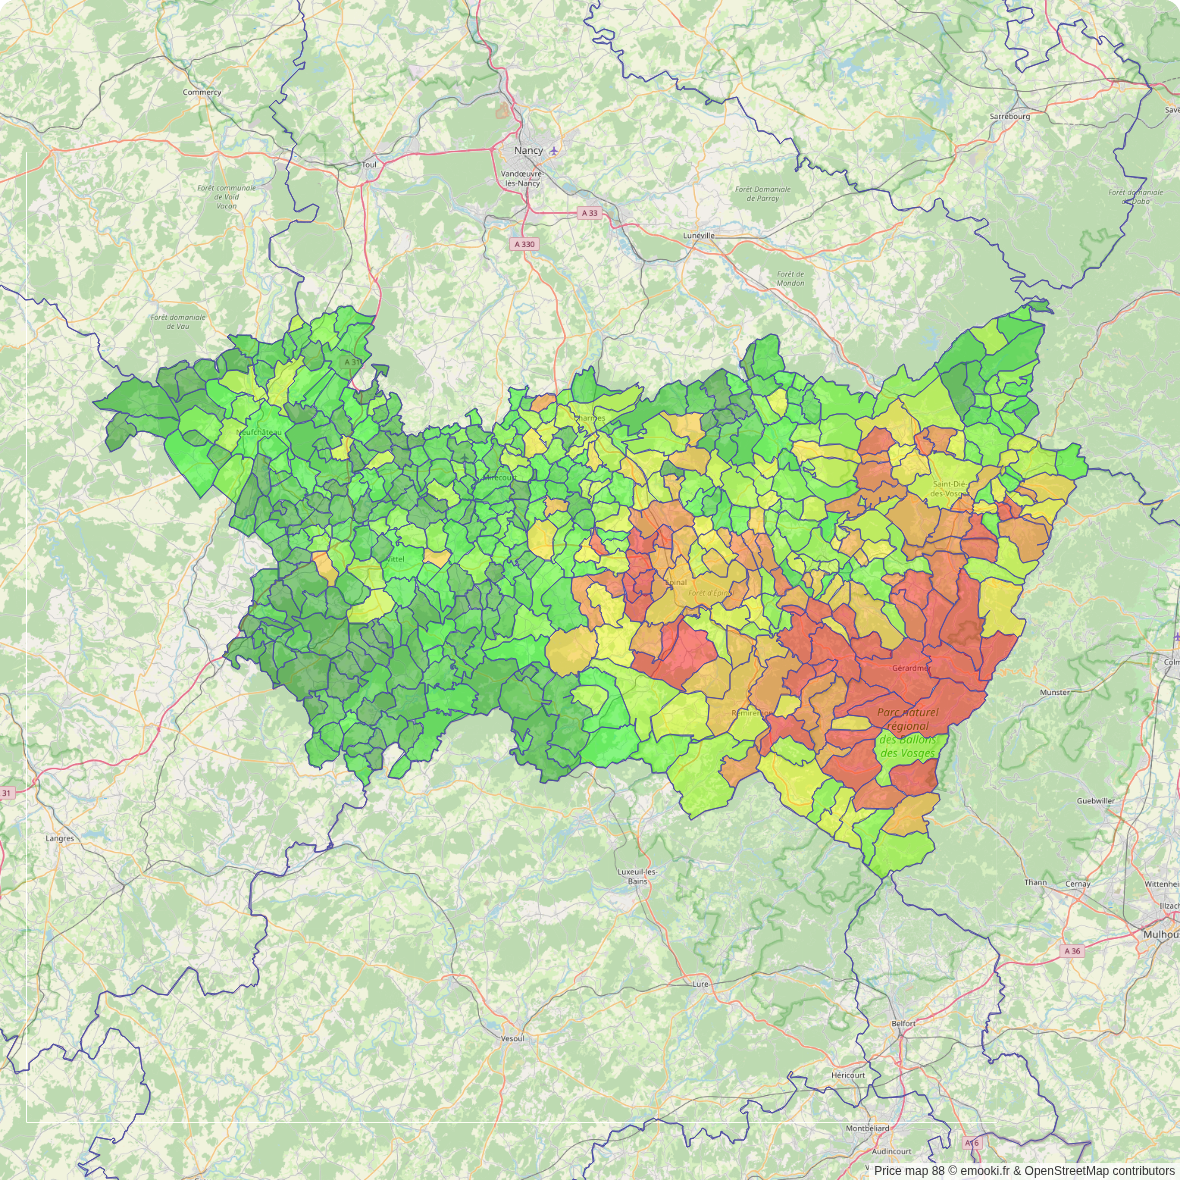
Median price of real estate
in the Vosges department

HousesHouses
1 429 € /m²
1-23-45-67-89-10
Reliability 10/10
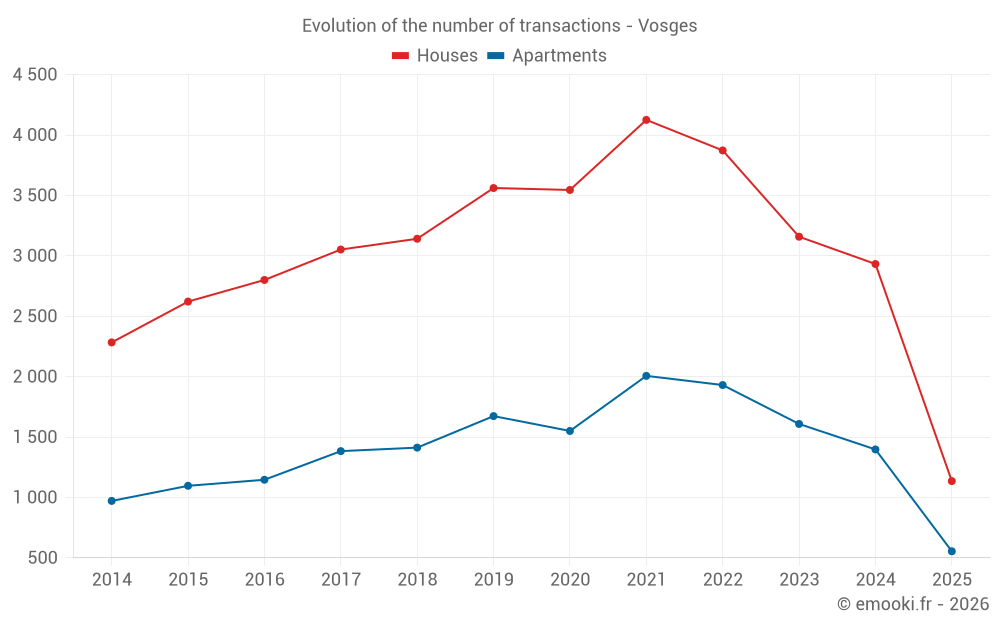
Median price on the 360 transactions of the last 3 months.
from 708 to
2 317 € /m²
60% of transactions from the 2nd to the 8th deciles.
ApartmentsApartments
1 242 € /m²
1-23-45-67-89-10
Reliability 10/10
Median price on the 219 transactions of the last 3 months.
from 691 to
1 962 € /m²
60% of transactions from the 2nd to the 8th deciles.
DwellingsDwellings
1 369 € /m²
1-23-45-67-89-10
Reliability 10/10
Median price on the 579 transactions of the last 3 months.
from 691 to
2 206 € /m²
60% of transactions from the 2nd to the 8th deciles.
HousesEvolution of the price per m² of houses since...
1 year
+1.5%
2 years
+1.7%
3 years
+2.6%
4 years
+13%
5 years
+17%
6 years
+23%
7 years
+27%
8 years
+27%
9 years
+30%
10 years
+27%
11 years
+27%
ApartmentsEvolution of the price per m² of apartments since...
1 year
+6.3%
2 years
+5.3%
3 years
+11%
4 years
+22%
5 years
+32%
6 years
+36%
7 years
+35%
8 years
+35%
9 years
+36%
10 years
+34%
11 years
+38%

Yearly evolution

Evolution of the median price per m²

Evolution of the number of transactions

Warning, last year incomplete. Projections made based on the proportions between semesters of the previous year at the departmental/national level and by type of property.

Yearly data

Descending order
Year
Houses
house
transactions
Houses
house
Price per m²
Apartments
apt.
transactions
Apartments
apt.
Price per m²
2025
1 135
1 369 €
554
1 217 €
2024
2 932
1 349 €
1 397
1 145 €
2023
3 158
1 346 €
1 608
1 156 €
2022
3 872
1 334 €
1 930
1 096 €
2021
4 125
1 207 €
2 006
1 000 €
2020
3 545
1 167 €
1 550
924 €
2019
3 561
1 111 €
1 673
896 €
2018
3 141
1 077 €
1 412
900 €
2017
3 052
1 076 €
1 383
899 €
2016
2 800
1 056 €
1 146
894 €
2015
2 621
1 081 €
1 096
906 €
2014
2 283
1 077 €
971
882 €

Analysis

Structure of prices per m²

Values of price percentiles per m² over the periods used for the estimated price of each type of property.

Structure of transaction amounts

Values of transaction amounts percentiles over the periods used for the estimated price of each type of property.

Transaction amounts and prices per m² by percentile

Ascending order
Percentile
Houses
house
Price per m²
Houses
house
Transaction amount
Apartments
apt.
Price per m²
Apartments
apt.
Transaction amount
10th percentile
417 €
37 850 €
521 €
35 000 €
20th percentile
708 €
64 400 €
691 €
50 000 €
30th percentile
940 €
93 700 €
905 €
62 120 €
40th percentile
1 173 €
116 K€
1 090 €
75 000 €
50th percentile
1 429 €
145 K€
1 242 €
93 000 €
60th percentile
1 664 €
166 K€
1 429 €
102 K€
70th percentile
1 942 €
198 K€
1 637 €
125 K€
80th percentile
2 317 €
236 K€
1 962 €
150 K€
90th percentile
2 839 €
306 K€
2 646 €
196 K€

Quarterly evolution

Evolution of the median price per m²

Evolution of the number of transactions

Quarterly data

Descending order
Quarter
Houses
house
transactions
Houses
house
Price per m²
Apartments
apt.
transactions
Apartments
apt.
Price per m²
2025 Q2
360
1 429 €
219
1 242 €
2025 Q1
775
1 348 €
335
1 208 €
2024 Q4
817
1 344 €
380
1 159 €
2024 Q3
816
1 407 €
370
1 189 €
2024 Q2
672
1 374 €
361
1 134 €
2024 Q1
627
1 241 €
286
1 084 €
2023 Q4
789
1 286 €
401
1 222 €
2023 Q3
868
1 364 €
400
1 138 €
2023 Q2
797
1 339 €
393
1 164 €
2023 Q1
704
1 386 €
414
1 088 €
2022 Q4
935
1 358 €
474
1 158 €
2022 Q3
1 096
1 422 €
490
1 122 €
2022 Q2
983
1 302 €
495
1 111 €
2022 Q1
858
1 259 €
471
956 €
2021 Q4
1 071
1 272 €
540
1 133 €
2021 Q3
1 202
1 282 €
530
1 012 €
2021 Q2
1 032
1 148 €
534
964 €
2021 Q1
820
1 122 €
402
920 €
2020 Q4
1 181
1 175 €
482
967 €
2020 Q3
997
1 200 €
402
946 €
2020 Q2
707
1 200 €
336
890 €
2020 Q1
660
1 024 €
330
915 €
2019 Q4
989
1 132 €
494
895 €
2019 Q3
1 057
1 159 €
434
900 €
2019 Q2
790
1 060 €
409
918 €
2019 Q1
725
1 063 €
336
869 €
2018 Q4
865
1 089 €
416
920 €
2018 Q3
834
1 124 €
371
829 €
2018 Q2
829
1 042 €
332
893 €
2018 Q1
613
1 048 €
293
930 €
2017 Q4
783
1 035 €
354
958 €
2017 Q3
848
1 100 €
366
872 €
2017 Q2
738
1 080 €
364
877 €
2017 Q1
683
1 061 €
299
924 €
2016 Q4
768
1 052 €
308
872 €
2016 Q3
813
1 079 €
296
954 €
2016 Q2
640
1 030 €
296
888 €
2016 Q1
579
1 053 €
246
900 €
2015 Q4
699
1 067 €
314
898 €
2015 Q3
785
1 105 €
280
940 €
2015 Q2
628
1 078 €
287
917 €
2015 Q1
509
1 024 €
215
820 €
2014 Q4
591
1 049 €
273
929 €
2014 Q3
618
1 120 €
244
818 €
2014 Q2
536
1 048 €
228
852 €
2014 Q1
538
1 084 €
226
909 €

Vosges (88)

Most expensive cities

City
name
Descending orderHouses
house
Price per m²
3 549 €
3 512 €
2 952 €
2 817 €
2 463 €
2 370 €
2 274 €
2 269 €
2 193 €
2 180 €
City
name
Descending orderApartments
apt.
Price per m²
2 834 €
2 832 €
2 778 €
2 460 €
2 128 €
1 964 €
1 912 €
1 750 €
1 618 €
1 596 €

Least expensive cities

City
name
Ascending orderHouses
house
Price per m²
177 €
208 €
217 €
235 €
244 €
246 €
256 €
276 €
303 €
304 €
City
name
Ascending orderApartments
apt.
Price per m²
74 €
86 €
121 €
127 €
130 €
143 €
150 €
157 €
179 €
186 €