Median price of real estate
in the municipality of Commequiers
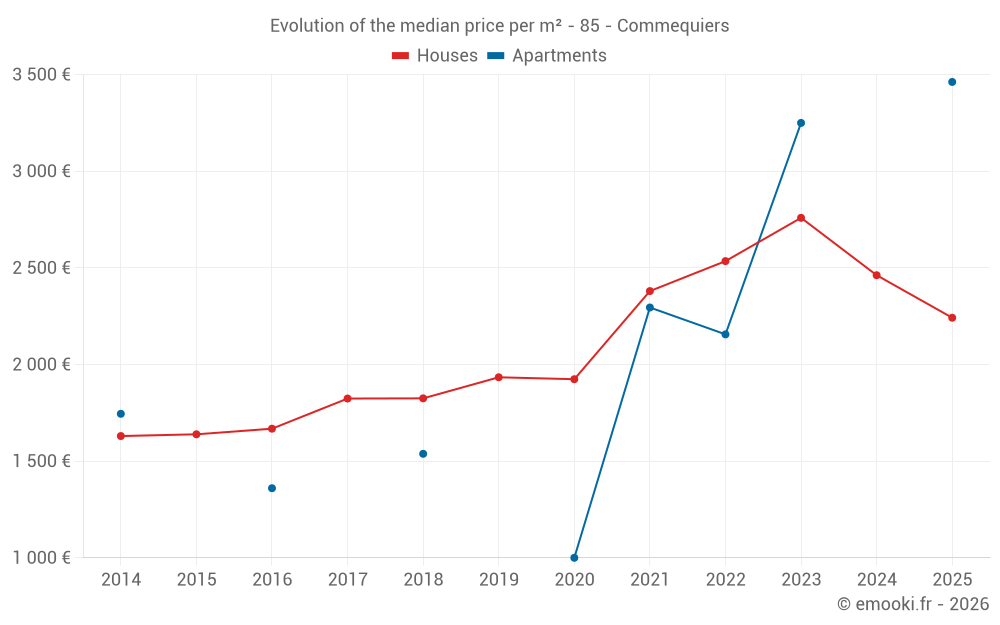
Houses
2 242 € /m²
Reliability 9/10
Median price on the 27 transactions of the last 6 months.
from 1 969 to
3 021 € /m²
3 021 € /m²
60% of transactions from the 2nd to the 8th deciles.
Apartments
2 772 € /m²
Reliability 3/10
Median price on the 6 transactions of the last 72 months.
Dwellings
2 288 € /m²
Reliability 9/10
Median price on the 28 transactions of the last 6 months.
from 1 977 to
3 051 € /m²
3 051 € /m²
60% of transactions from the 2nd to the 8th deciles.