emooki
HomePrice mapTransactions
🇬🇧 English🇫🇷 Français🇩🇪 Deutsch🇪🇸 Español🇮🇹 Italiano

Real estate price map


Real estate price map in the municipality of Moissac.

Tarn-et-Garonne (82)
Moissac

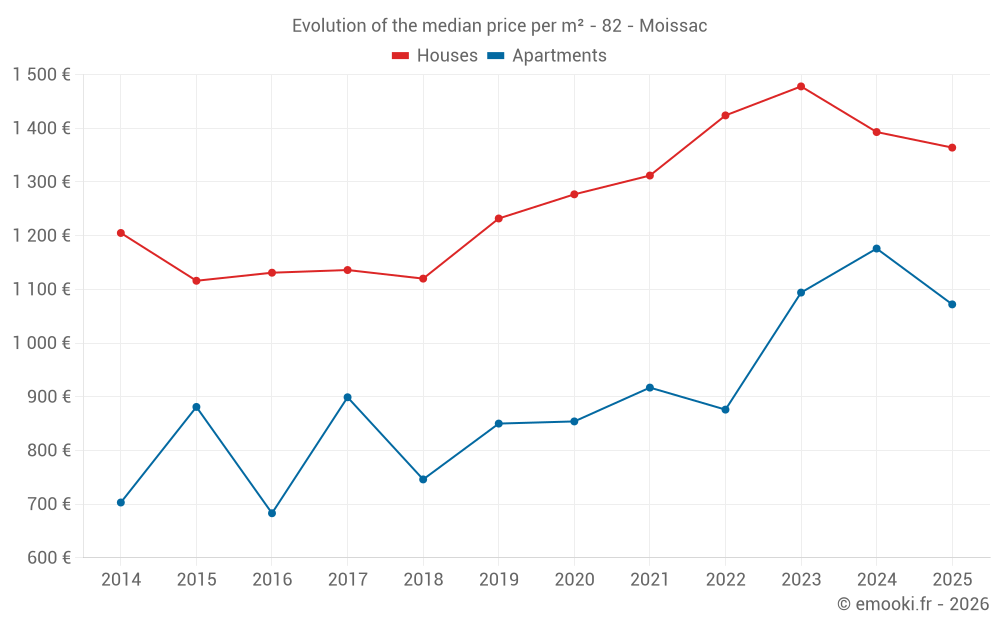
Median price of real estate
in the municipality of Moissac

HousesHouses
1 374 € /m²
1-23-45-67-89-10
Reliability 10/10
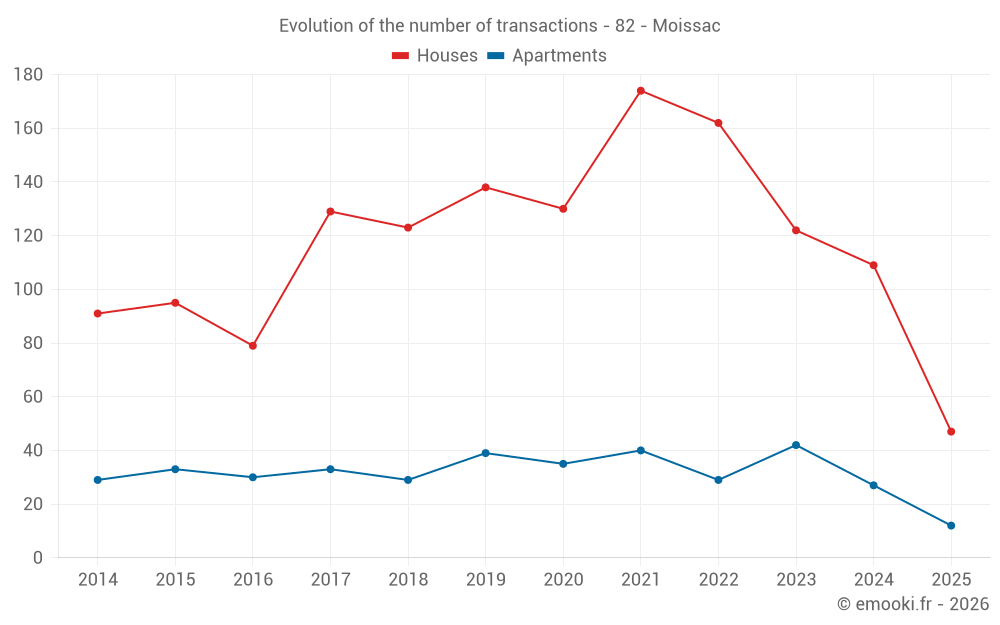
Median price on the 23 transactions of the last 3 months.
from 966 to
1 756 € /m²
60% of transactions from the 2nd to the 8th deciles.
ApartmentsApartments
1 014 € /m²
1-23-45-67-89-10
Reliability 8/10
Median price on the 26 transactions of the last 12 months.
from 753 to
1 448 € /m²
60% of transactions from the 2nd to the 8th deciles.
DwellingsDwellings
1 374 € /m²
1-23-45-67-89-10
Reliability 10/10
Median price on the 27 transactions of the last 3 months.
from 962 to
1 729 € /m²
60% of transactions from the 2nd to the 8th deciles.
HousesEvolution of the price per m² of houses since...
1 year
-2.1%
2 years
-7.7%
3 years
-4.2%
4 years
+4%
5 years
+6.8%
6 years
+11%
7 years
+22%
8 years
+20%
9 years
+21%
10 years
+22%
11 years
+13%
ApartmentsEvolution of the price per m² of apartments since...
1 year
-8.8%
2 years
-2%
3 years
+22%
4 years
+17%
5 years
+26%
6 years
+26%
7 years
+44%
8 years
+19%
9 years
+57%
10 years
+22%
11 years
+52%

Yearly evolution

Evolution of the median price per m²

Evolution of the number of transactions

Warning, last year incomplete. Projections made based on the proportions between semesters of the previous year at the departmental/national level and by type of property.

Yearly data

Descending order
Year
Houses
house
transactions
Houses
house
Price per m²
Apartments
apt.
transactions
Apartments
apt.
Price per m²
2025
47
1 364 €
12
1 072 €
2024
109
1 393 €
27
1 176 €
2023
122
1 478 €
42
1 094 €
2022
162
1 424 €
29
876 €
2021
174
1 312 €
40
917 €
2020
130
1 277 €
35
854 €
2019
138
1 232 €
39
850 €
2018
123
1 120 €
29
746 €
2017
129
1 136 €
33
899 €
2016
79
1 131 €
30
683 €
2015
95
1 116 €
33
881 €
2014
91
1 205 €
29
703 €

Analysis

Structure of prices per m²

Values of price percentiles per m² over the periods used for the estimated price of each type of property.

Structure of transaction amounts

Values of transaction amounts percentiles over the periods used for the estimated price of each type of property.

Transaction amounts and prices per m² by percentile

Ascending order
Percentile
Houses
house
Price per m²
Houses
house
Transaction amount
Apartments
apt.
Price per m²
Apartments
apt.
Transaction amount
10th percentile
734 €
78 800 €
660 €
49 107 €
20th percentile
966 €
102 K€
753 €
63 200 €
30th percentile
1 102 €
127 K€
840 €
77 225 €
40th percentile
1 337 €
134 K€
894 €
110 K€
50th percentile
1 374 €
145 K€
1 014 €
118 K€
60th percentile
1 653 €
150 K€
1 122 €
135 K€
70th percentile
1 681 €
154 K€
1 336 €
155 K€
80th percentile
1 756 €
171 K€
1 448 €
163 K€
90th percentile
1 782 €
198 K€
1 498 €
208 K€

National and departmental comparison

Evolution of the median price per m² of houses

Evolution of the median price per m² of apartments

Quarterly evolution

Evolution of the median price per m²

Evolution of the number of transactions

Quarterly data

Descending order
Quarter
Houses
house
transactions
Houses
house
Price per m²
Apartments
apt.
transactions
Apartments
apt.
Price per m²
2025 Q2
23
1 374 €
4
1 280 €
2025 Q1
24
1 202 €
8
937 €
2024 Q4
37
1 412 €
11
895 €
2024 Q3
25
1 537 €
3
994 €
2024 Q2
26
1 263 €
5
1 417 €
2024 Q1
21
1 235 €
8
1 406 €
2023 Q4
31
1 500 €
6
1 084 €
2023 Q3
32
1 520 €
13
1 389 €
2023 Q2
28
1 486 €
11
951 €
2023 Q1
31
1 316 €
12
1 054 €
2022 Q4
43
1 521 €
7
1 103 €
2022 Q3
44
1 456 €
7
792 €
2022 Q2
44
1 378 €
8
802 €
2022 Q1
31
1 167 €
7
948 €
2021 Q4
40
1 410 €
10
908 €
2021 Q3
58
1 417 €
10
917 €
2021 Q2
40
1 328 €
11
960 €
2021 Q1
36
1 034 €
9
867 €
2020 Q4
36
1 354 €
10
919 €
2020 Q3
29
1 444 €
14
1 046 €
2020 Q2
30
1 240 €
5
574 €
2020 Q1
35
1 100 €
6
677 €
2019 Q4
36
1 300 €
9
833 €
2019 Q3
40
1 428 €
14
864 €
2019 Q2
30
1 151 €
7
938 €
2019 Q1
32
1 194 €
9
746 €
2018 Q4
34
1 010 €
7
580 €
2018 Q3
39
1 189 €
8
665 €
2018 Q2
29
1 125 €
8
838 €
2018 Q1
21
1 073 €
6
844 €
2017 Q4
33
1 019 €
8
938 €
2017 Q3
44
1 240 €
8
1 006 €
2017 Q2
22
1 132 €
8
704 €
2017 Q1
30
998 €
9
839 €
2016 Q4
24
1 028 €
5
636 €
2016 Q3
17
1 188 €
9
714 €
2016 Q2
19
1 184 €
7
625 €
2016 Q1
19
1 190 €
9
1 065 €
2015 Q4
23
1 083 €
10
793 €
2015 Q3
26
1 232 €
9
1 052 €
2015 Q2
30
1 092 €
7
594 €
2015 Q1
16
1 042 €
7
577 €
2014 Q4
22
1 385 €
10
674 €
2014 Q3
22
1 167 €
5
635 €
2014 Q2
22
1 202 €
10
894 €
2014 Q1
25
1 183 €
4
600 €

Tarn-et-Garonne (82)

Most expensive cities

City
name
Descending orderHouses
house
Price per m²
2 797 €
2 620 €
2 616 €
2 419 €
2 352 €
2 333 €
2 294 €
2 289 €
2 288 €
2 264 €
City
name
Descending orderApartments
apt.
Price per m²
6 095 €
2 392 €
2 387 €
2 084 €
1 892 €
1 819 €
1 806 €
1 803 €
1 803 €
1 796 €

Least expensive cities

City
name
Ascending orderHouses
house
Price per m²
641 €
844 €
850 €
912 €
938 €
944 €
968 €
968 €
1 052 €
1 068 €
City
name
Ascending orderApartments
apt.
Price per m²
108 €
116 €
156 €
174 €
288 €
333 €
381 €
397 €
455 €