emooki
HomePrice mapTransactions
🇬🇧 English🇫🇷 Français🇩🇪 Deutsch🇪🇸 Español🇮🇹 Italiano

Real estate price map


Real estate price map in the municipality of Castelsarrasin, choose a section to see transactions by parcel.

Tarn-et-Garonne (82)

Castelsarrasin - Real estate price m²

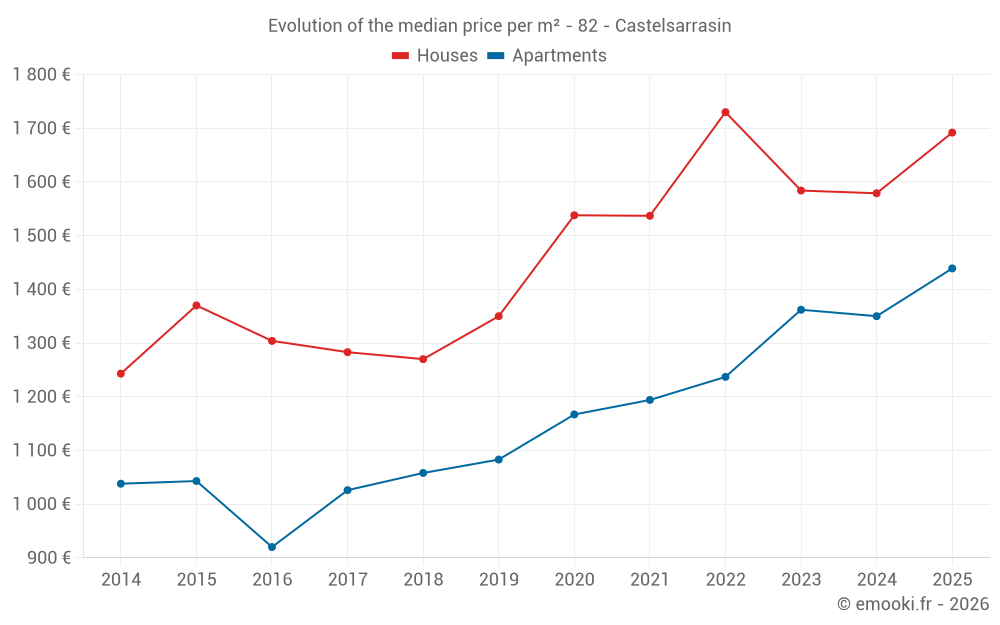
Median price of real estate
in the municipality of Castelsarrasin

HousesHouses
1 692  /m²
1-23-45-67-89-10
Reliability 9/10
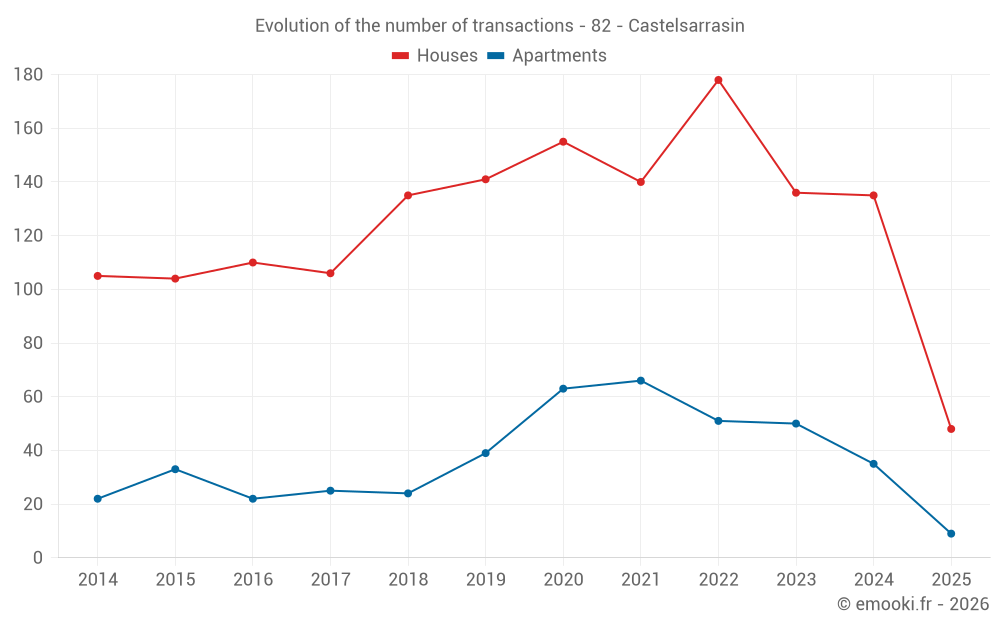
Median price on the 48 transactions of the last 6 months.
from 1 304 to
2 119  /m²
60% of transactions from the 2nd to the 8th deciles.
ApartmentsApartments
1 448  /m²
1-23-45-67-89-10
Reliability 8/10
Median price on the 28 transactions of the last 12 months.
from 863 to
1 770  /m²
60% of transactions from the 2nd to the 8th deciles.
DwellingsDwellings
1 630  /m²
1-23-45-67-89-10
Reliability 9/10
Median price on the 57 transactions of the last 6 months.
from 1 302 to
2 112  /m²
60% of transactions from the 2nd to the 8th deciles.
HousesEvolution of the price per m² of houses since...
1 year
+7.2%
2 years
+6.8%
3 years
-2.2%
4 years
+10%
5 years
+10%
6 years
+25%
7 years
+33%
8 years
+32%
9 years
+30%
10 years
+24%
11 years
+36%
The price per m² of houses has decreased by 2.2% since 3 years, but it has increased by 36% in 11 years.
ApartmentsEvolution of the price per m² of apartments since...
1 year
+6.6%
2 years
+5.7%
3 years
+16%
4 years
+21%
5 years
+23%
6 years
+33%
7 years
+36%
8 years
+40%
9 years
+56%
10 years
+38%
11 years
+39%

Yearly evolution

Evolution of the median price per m²

Evolution of the median price per m² - 82 - Castelsarrasin

Evolution of the number of transactions

Warning, last year incomplete. Projections made based on the proportions between semesters of the previous year at the departmental/national level and by type of property.

Evolution of the number of transactions - 82 - Castelsarrasin

Yearly data

Descending order
Year
Houses
house
transactions
Houses
house
Price per m²
Apartments
apt.
transactions
Apartments
apt.
Price per m²
2025
48
1 692 
9
1 439 
2024
135
1 579 
35
1 350 
2023
136
1 584 
50
1 362 
2022
178
1 730 
51
1 237 
2021
140
1 537 
66
1 194 
2020
155
1 538 
63
1 167 
2019
141
1 350 
39
1 083 
2018
135
1 270 
24
1 058 
2017
106
1 283 
25
1 026 
2016
110
1 304 
22
920 
2015
104
1 370 
33
1 043 
2014
105
1 243 
22
1 038 

Analysis

Structure of prices per m²

Values of price percentiles per m² over the periods used for the estimated price of each type of property.

Structure of transaction amounts

Values of transaction amounts percentiles over the periods used for the estimated price of each type of property.

Transaction amounts and prices per m² by percentile

Ascending order
Percentile
Houses
house
Price per m²
Houses
house
Transaction amount
Apartments
apt.
Price per m²
Apartments
apt.
Transaction amount
10th percentile
1 063 
89 197 
531 
37 750 
20th percentile
1 304 
113 K
863 
64 400 
30th percentile
1 478 
125 K
1 179 
68 200 
40th percentile
1 609 
146 K
1 423 
75 000 
50th percentile
1 692 
161 K
1 448 
80 750 
60th percentile
1 837 
179 K
1 525 
83 400 
70th percentile
2 005 
211 K
1 662 
89 671 
80th percentile
2 119 
241 K
1 770 
108 K
90th percentile
2 280 
257 K
1 962 
137 K

National and departmental comparison

Evolution of the median price per m² of houses

Evolution of the median price per m² of apartments

Quarterly evolution

Evolution of the median price per m²

Evolution of the number of transactions

Quarterly data

Descending order
Quarter
Houses
house
transactions
Houses
house
Price per m²
Apartments
apt.
transactions
Apartments
apt.
Price per m²
2025 Q2
13
1 778 
3
1 439 
2025 Q1
35
1 632 
6
1 436 
2024 Q4
39
1 491 
9
1 509 
2024 Q3
32
1 712 
10
1 546 
2024 Q2
44
1 558 
8
910 
2024 Q1
20
1 496 
8
1 339 
2023 Q4
32
1 540 
15
1 333 
2023 Q3
34
1 788 
10
1 436 
2023 Q2
35
1 486 
17
1 311 
2023 Q1
35
1 681 
8
1 370 
2022 Q4
40
1 627 
8
1 202 
2022 Q3
53
1 980 
13
1 357 
2022 Q2
40
1 701 
10
1 149 
2022 Q1
45
1 566 
20
1 230 
2021 Q4
32
1 608 
22
1 258 
2021 Q3
46
1 511 
15
1 188 
2021 Q2
34
1 460 
15
1 034 
2021 Q1
28
1 434 
14
1 177 
2020 Q4
58
1 567 
19
1 264 
2020 Q3
40
1 456 
13
1 117 
2020 Q2
29
1 500 
20
1 128 
2020 Q1
28
1 461 
11
1 094 
2019 Q4
40
1 364 
10
1 045 
2019 Q3
42
1 356 
11
1 081 
2019 Q2
33
1 279 
8
1 186 
2019 Q1
26
1 392 
10
1 088 
2018 Q4
45
1 381 
2
1 200 
2018 Q3
39
1 301 
10
1 000 
2018 Q2
30
1 230 
8
1 108 
2018 Q1
21
1 242 
4
1 027 
2017 Q4
28
1 200 
2
1 018 
2017 Q3
28
1 361 
5
1 047 
2017 Q2
26
1 291 
13
1 025 
2017 Q1
24
1 160 
5
1 176 
2016 Q4
28
1 362 
8
899 
2016 Q3
30
1 240 
6
769 
2016 Q2
27
1 368 
6
1 085 
2016 Q1
25
1 313 
2
996 
2015 Q4
27
1 274 
15
688 
2015 Q3
26
1 458 
9
1 229 
2015 Q2
25
1 387 
3
1 340 
2015 Q1
26
1 126 
6
1 182 
2014 Q4
27
1 361 
3
1 090 
2014 Q3
28
1 170 
3
1 073 
2014 Q2
24
1 344 
8
944 
2014 Q1
26
1 290 
8
1 038 

Overview of the latest real estate transactions

The following list is an anonymized overview of the latest transactions. For more details and to find all transactions, please use the map to view transactions by plot or the transaction search page for a search by criteria.

2025-06-16
1 400 000 
1 634  /m²(857 m²)
Sale
Houses
House
4 rooms
83 m2
Houses
House
4 rooms
83 m2
Houses
House
5 rooms
102 m2
Houses
House
6 rooms
114 m2
Houses
House
5 rooms
94 m2
Houses
House
4 rooms
84 m2
Houses
House
5 rooms
94 m2
Houses
House
5 rooms
109 m2
Houses
House
5 rooms
94 m2
2025-06-13
42 000 
Sale
Land
1552 m2
-Terres
2025-06-06
77 400 
645  /m²(120 m²)
Sale
Houses
House
3 rooms
120 m2
2025-06-05
59 201 
Sale
Land
6 m2
-Terrains à bâtir
Land
892 m2
-Terrains à bâtir
Land
5324 m2
-Terrains à bâtir
2025-06-05
252 550 
2 122  /m²(119 m²)
Sale
Houses
House
5 rooms
119 m2
Land
296 m2
-Terres
Land
654 m2
-Terres
2025-06-04
80 000 
1 311  /m²(61 m²)
Sale
Apartments
Apartment
2 rooms
61 m2
1 outbuilding
2025-05-27
198 800 
2 008  /m²(99 m²)
Sale
Houses
House
6 rooms
99 m2
Land
2124 m2
-Sols
2025-05-21
20 000 
202  /m²(99 m²)
Sale
Houses
House
5 rooms
99 m2
2025-05-21
12 000 
Sale
Land
1495 m2
-Terres
2025-05-20
92 000 
Sale
Land
10561 m2
-Terres
2025-05-20
168 000 
55  /m²(3076 m²)
transaction.nature.Vente terrain à bâtir
Commercial property
3076 m2
Land
2195 m2
-Sols
Land
120 m2
-Sols
Land
354 m2
-Sols
Land
3157 m2
-Sols
2025-05-20
600 000 
120  /m²(5000 m²)
Sale
Commercial property
5000 m2
Land
3000 m2
-Sols
Land
2140 m2
-Terres
2025-05-17
48 000 
Sale
Land
864 m2
-Terres
2025-05-13
192 000 
1 778  /m²(108 m²)
Sale
Houses
House
4 rooms
108 m2
Land
671 m2
-Sols
Land
403 m2
-Jardins
/Pré marais
2025-05-13
55 000 
Sale
Land
2010 m2
-Terres
2025-05-13
170 000 
637  /m²(267 m²)
846  /m²(201 m²)
Sale
Apartments
Apartment
2 rooms
41 m2
Houses
House
7 rooms
160 m2
Commercial property
66 m2
1 outbuilding
Land
173 m2
-Sols
2025-05-07
110 000 
1 833  /m²(60 m²)
Sale
Houses
House
3 rooms
60 m2
Land
371 m2
-Sols
2025-05-07
70 500 
Sale
Land
62 m2
-Peupleraies
Land
217 m2
-Peupleraies
Land
122 m2
-Terres
Land
1268 m2
-Terres
Land
113 m2
-Terres
Land
2291 m2
-Terres
Land
93 m2
-Terres
Land
721 m2
-Terres
2025-05-05
117 500 
1 610  /m²(73 m²)
Sale
Houses
House
3 rooms
73 m2
Land
161 m2
-Sols
2025-04-30
922 500 
1 200  /m²(769 m²)
Sale
Commercial property
538 m2
Commercial property
231 m2
2973 transactions listed in the municipality

Tarn-et-Garonne (82)

Most expensive cities

City
name
Descending orderHouses
house
Price per m²
2 797 
2 620 
2 616 
2 419 
2 352 
2 333 
2 294 
2 289 
2 288 
2 264 
City
name
Descending orderApartments
apt.
Price per m²
6 095 
2 392 
2 387 
2 084 
1 892 
1 819 
1 803 

Least expensive cities

City
name
Ascending orderHouses
house
Price per m²
641 
844 
850 
944 
968 
1 052 
1 068 
City
name
Ascending orderApartments
apt.
Price per m²
108 
116 
156 
174 
288 
333 
381 
397 
455