emooki
HomePrice mapTransactions
🇬🇧 English🇫🇷 Français🇩🇪 Deutsch🇪🇸 Español🇮🇹 Italiano

Real estate price map


Real estate price map in the municipality of Grisolles, choose a section to see transactions by parcel.

Tarn-et-Garonne (82)

Grisolles - Real estate price m²

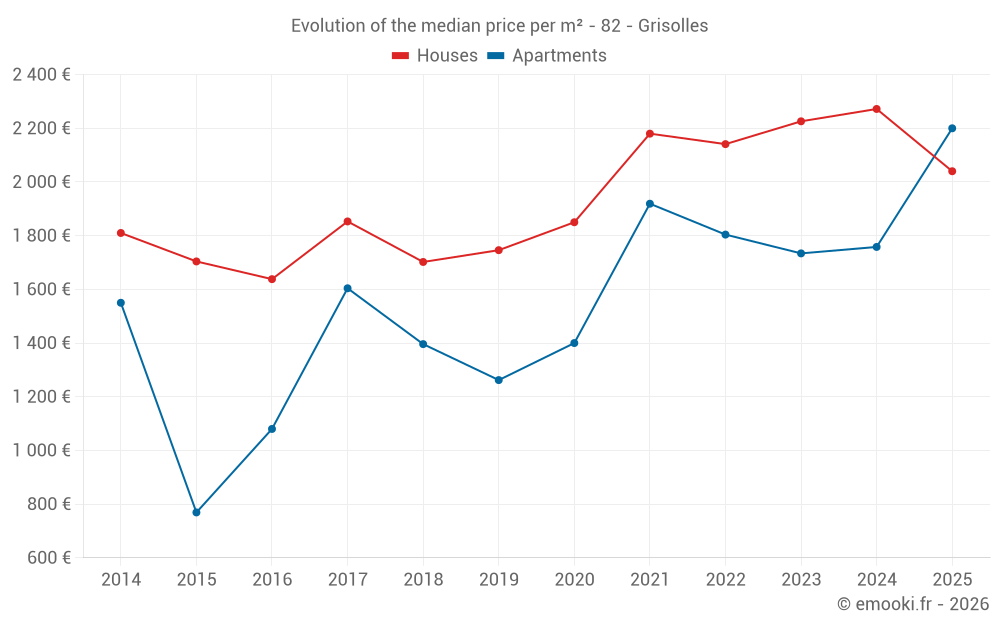
Median price of real estate
in the municipality of Grisolles

HousesHouses
2 165  /m²
1-23-45-67-89-10
Reliability 8/10
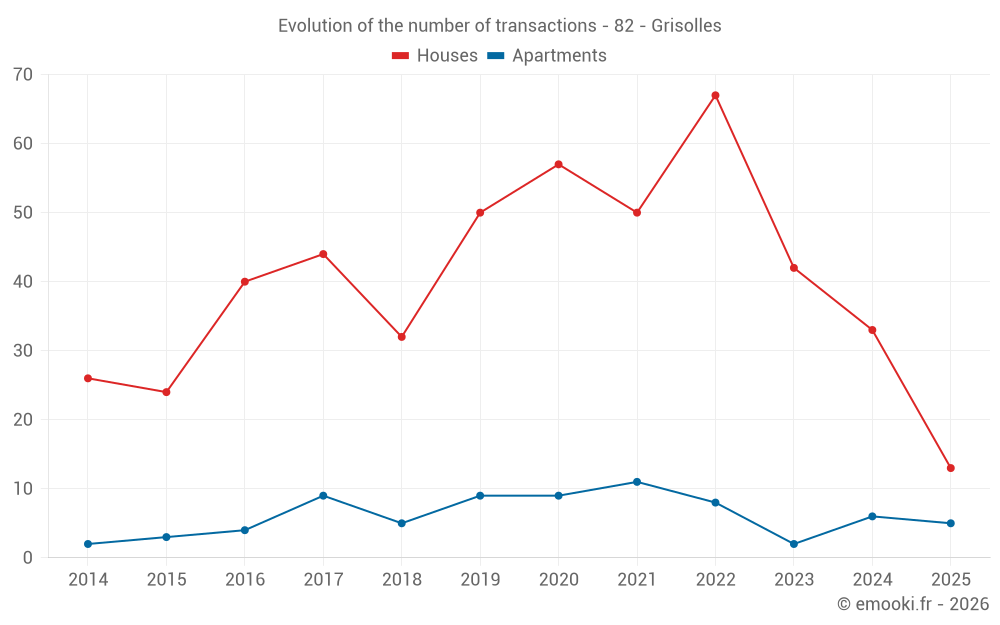
Median price on the 33 transactions of the last 12 months.
from 1 269 to
2 615  /m²
60% of transactions from the 2nd to the 8th deciles.
ApartmentsApartments
1 819  /m²
1-23-45-67-89-10
Reliability 6/10
Median price on the 20 transactions of the last 36 months.
from 1 487 to
2 154  /m²
60% of transactions from the 2nd to the 8th deciles.
DwellingsDwellings
2 065  /m²
1-23-45-67-89-10
Reliability 9/10
Median price on the 18 transactions of the last 6 months.
from 1 167 to
2 368  /m²
60% of transactions from the 2nd to the 8th deciles.
HousesEvolution of the price per m² of houses since...
1 year
-10%
2 years
-8.4%
3 years
-4.7%
4 years
-6.4%
5 years
+10%
6 years
+17%
7 years
+20%
8 years
+10%
9 years
+25%
10 years
+20%
11 years
+13%
The price per m² of houses has decreased by 10% since 1 year, but it has increased by 25% in 9 years.
ApartmentsEvolution of the price per m² of apartments since...
1 year
+25%
2 years
--
3 years
+22%
4 years
+15%
5 years
+57%
6 years
+74%
7 years
+58%
8 years
+37%
9 years
+104%
10 years
--
11 years
--

Yearly evolution

Evolution of the median price per m²

Evolution of the median price per m² - 82 - Grisolles

Evolution of the number of transactions

Warning, last year incomplete. Projections made based on the proportions between semesters of the previous year at the departmental/national level and by type of property.

Evolution of the number of transactions - 82 - Grisolles

Yearly data

Descending order
Year
Houses
house
transactions
Houses
house
Price per m²
Apartments
apt.
transactions
Apartments
apt.
Price per m²
2025
13
2 040 
5
2 200 
2024
33
2 272 
6
1 758 
2023
42
2 226 
2
1 734 
2022
67
2 141 
8
1 804 
2021
50
2 180 
11
1 919 
2020
57
1 850 
9
1 400 
2019
50
1 746 
9
1 262 
2018
32
1 702 
5
1 396 
2017
44
1 853 
9
1 604 
2016
40
1 638 
4
1 080 
2015
24
1 704 
3
769 
2014
26
1 810 
2
1 550 

Analysis

Structure of prices per m²

Values of price percentiles per m² over the periods used for the estimated price of each type of property.

Structure of transaction amounts

Values of transaction amounts percentiles over the periods used for the estimated price of each type of property.

Transaction amounts and prices per m² by percentile

Ascending order
Percentile
Houses
house
Price per m²
Houses
house
Transaction amount
Apartments
apt.
Price per m²
Apartments
apt.
Transaction amount
10th percentile
1 102 
143 K
1 267 
59 850 
20th percentile
1 269 
155 K
1 487 
78 300 
30th percentile
1 960 
200 K
1 634 
85 550 
40th percentile
2 019 
209 K
1 673 
92 200 
50th percentile
2 165 
236 K
1 819 
102 K
60th percentile
2 399 
250 K
1 999 
104 K
70th percentile
2 522 
263 K
2 108 
114 K
80th percentile
2 615 
281 K
2 154 
122 K
90th percentile
2 743 
314 K
2 234 
165 K

National and departmental comparison

Evolution of the median price per m² of houses

Evolution of the median price per m² of apartments

Quarterly evolution

Evolution of the median price per m²

Evolution of the number of transactions

Quarterly data

Descending order
Quarter
Houses
house
transactions
Houses
house
Price per m²
Apartments
apt.
transactions
Apartments
apt.
Price per m²
2025 Q2
5
2 040 
2
1 612 
2025 Q1
8
2 146 
3
2 200 
2024 Q4
9
2 593 
3
2 116 
2024 Q3
11
2 018 
0
--- 
2024 Q2
8
2 155 
2
1 742 
2024 Q1
5
2 272 
1
1 671 
2023 Q4
11
2 311 
0
--- 
2023 Q3
12
2 339 
1
1 675 
2023 Q2
11
2 051 
0
--- 
2023 Q1
8
2 214 
1
1 792 
2022 Q4
15
2 154 
4
1 559 
2022 Q3
20
2 104 
3
2 018 
2022 Q2
15
2 112 
0
--- 
2022 Q1
17
2 286 
1
796 
2021 Q4
15
2 229 
5
2 012 
2021 Q3
10
2 230 
1
1 843 
2021 Q2
18
2 111 
2
1 850 
2021 Q1
7
2 171 
3
1 656 
2020 Q4
11
2 068 
2
1 418 
2020 Q3
14
1 806 
1
1 580 
2020 Q2
17
1 800 
2
1 270 
2020 Q1
15
1 850 
4
1 714 
2019 Q4
19
2 023 
5
1 262 
2019 Q3
7
1 810 
0
--- 
2019 Q2
13
1 557 
1
1 796 
2019 Q1
11
1 603 
3
1 216 
2018 Q4
10
2 033 
2
1 688 
2018 Q3
12
1 702 
1
1 396 
2018 Q2
4
1 618 
1
1 159 
2018 Q1
6
1 698 
1
1 224 
2017 Q4
11
2 199 
3
1 442 
2017 Q3
8
1 760 
2
1 260 
2017 Q2
15
1 731 
2
1 714 
2017 Q1
10
1 799 
2
1 643 
2016 Q4
15
1 863 
1
144 
2016 Q3
10
1 514 
1
1 045 
2016 Q2
10
1 478 
2
1 698 
2016 Q1
5
640 
0
--- 
2015 Q4
1
1 111 
0
--- 
2015 Q3
12
1 524 
1
919 
2015 Q2
5
2 029 
2
724 
2015 Q1
6
1 704 
0
--- 
2014 Q4
8
1 474 
0
--- 
2014 Q3
6
1 843 
1
1 111 
2014 Q2
5
2 341 
0
--- 
2014 Q1
7
1 777 
1
1 990 

Overview of the latest real estate transactions

The following list is an anonymized overview of the latest transactions. For more details and to find all transactions, please use the map to view transactions by plot or the transaction search page for a search by criteria.

2025-06-05
43 512 
Sale
Land
30060 m2
-Terres
Land
6200 m2
-Terres
2025-06-02
1 068 
Sale
Land
919 m2
-Taillis simples
Land
320 m2
-Terres
Land
860 m2
-Peupleraies
2025-06-02
5 932 
Sale
Land
8497 m2
-Taillis simples
Land
3166 m2
-Terres
2025-05-28
186 000 
2 090  /m²(89 m²)
Sale
Houses
House
3 rooms
89 m2
Land
346 m2
-Sols
2025-05-27
310 000 
Sale
Land
839 m2
-Sols
Land
369 m2
-Sols
2025-05-22
204 000 
2 040  /m²(100 m²)
Sale
Houses
House
4 rooms
100 m2
Land
225 m2
-Sols
2025-05-22
145 000 
806  /m²(180 m²)
Sale
Houses
House
8 rooms
180 m2
Land
513 m2
-Sols
2025-05-15
161 950 
1 705  /m²(95 m²)
Sale
Houses
House
1 room
95 m2
Commercial property
1 outbuilding
Land
947 m2
-Sols
2025-04-28
260 000 
1 000  /m²(260 m²)
Sale
Apartments
Apartment
4 rooms
55 m2
Apartments
Apartment
3 rooms
67 m2
Apartments
Apartment
3 rooms
93 m2
Apartments
Apartment
3 rooms
45 m2
1 outbuilding
Land
398 m2
-Sols
2025-04-24
160 000 
1 143  /m²(140 m²)
Sale
Houses
House
4 rooms
140 m2
Land
1567 m2
-Sols
2025-04-24
355 000 
2 630  /m²(135 m²)
Sale
Houses
House
6 rooms
135 m2
Land
894 m2
-Sols
2025-04-16
84 500 
2 224  /m²(38 m²)
Sale
Apartments
Apartment
2 rooms
38 m2
1 outbuilding
2025-04-14
100 000 
Sale
Land
1152 m2
-Terres
2025-04-11
100 000 
Sale
Land
1152 m2
-Terres
2025-03-31
88 000 
2 200  /m²(40 m²)
Sale
Apartments
Apartment
1 room
40 m2
1 outbuilding
2025-03-28
350 000 
2 692  /m²(130 m²)
Sale
Land
120 m2
-Landes
/Pâture plantée
Land
124 m2
-Landes
/Pâture plantée
Houses
House
4 rooms
130 m2
Land
1000 m2
-Sols
Land
1542 m2
-Terrains d'agrément
2025-03-27
4 656 
Sale
Land
78 m2
-Sols
2025-03-17
48 000 
1 297  /m²(37 m²)
Sale
Apartments
Apartment
2 rooms
37 m2
1 outbuilding
2025-03-14
101 000 
Sale
Land
169 m2
-Sols
Land
594 m2
-Sols
Land
834 m2
-Terres
2025-03-13
275 000 
1 786  /m²(154 m²)
Sale
Houses
House
4 rooms
154 m2
Land
1000 m2
-Sols
Land
1000 m2
-Terrains d'agrément
Land
30 m2
-Sols
840 transactions listed in the municipality

Tarn-et-Garonne (82)

Most expensive cities

City
name
Descending orderHouses
house
Price per m²
2 797 
2 620 
2 616 
2 419 
2 352 
2 333 
2 294 
2 289 
2 288 
2 264 
City
name
Descending orderApartments
apt.
Price per m²
6 095 
2 392 
2 387 
2 084 
1 892 
1 819 
1 803 

Least expensive cities

City
name
Ascending orderHouses
house
Price per m²
641 
844 
850 
944 
968 
1 052 
1 068 
City
name
Ascending orderApartments
apt.
Price per m²
108 
116 
156 
174 
288 
333 
381 
397 
455