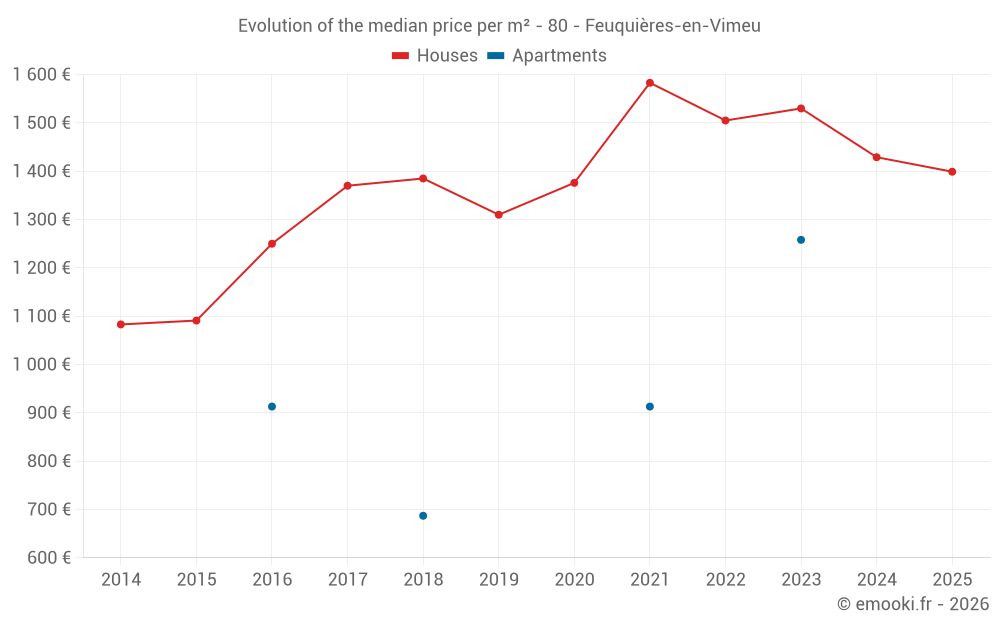
Median price of real estate
in the municipality of Feuquières-en-Vimeu
Houses
1 411 € /m²
Reliability 8/10
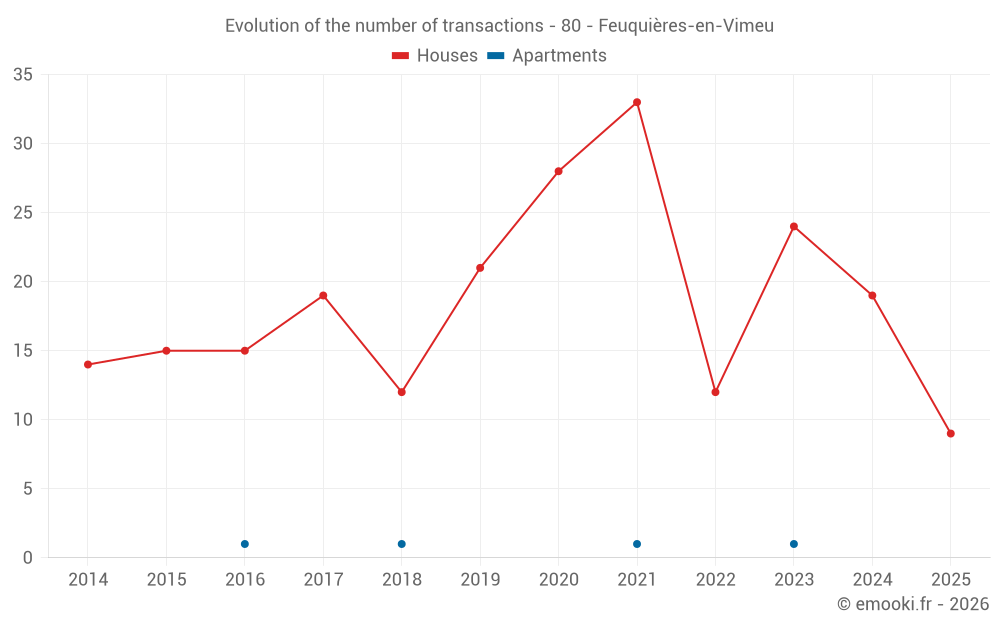
Median price on the 21 transactions of the last 12 months.
from 1 125 to
1 920 € /m²
1 920 € /m²
60% of transactions from the 2nd to the 8th deciles.
Apartments
913 € /m²
Reliability 1/10
Median price on the 4 transactions of the last 120 months.
Dwellings
1 411 € /m²
Reliability 8/10
Median price on the 21 transactions of the last 12 months.
from 1 125 to
1 920 € /m²
1 920 € /m²
60% of transactions from the 2nd to the 8th deciles.